Problem
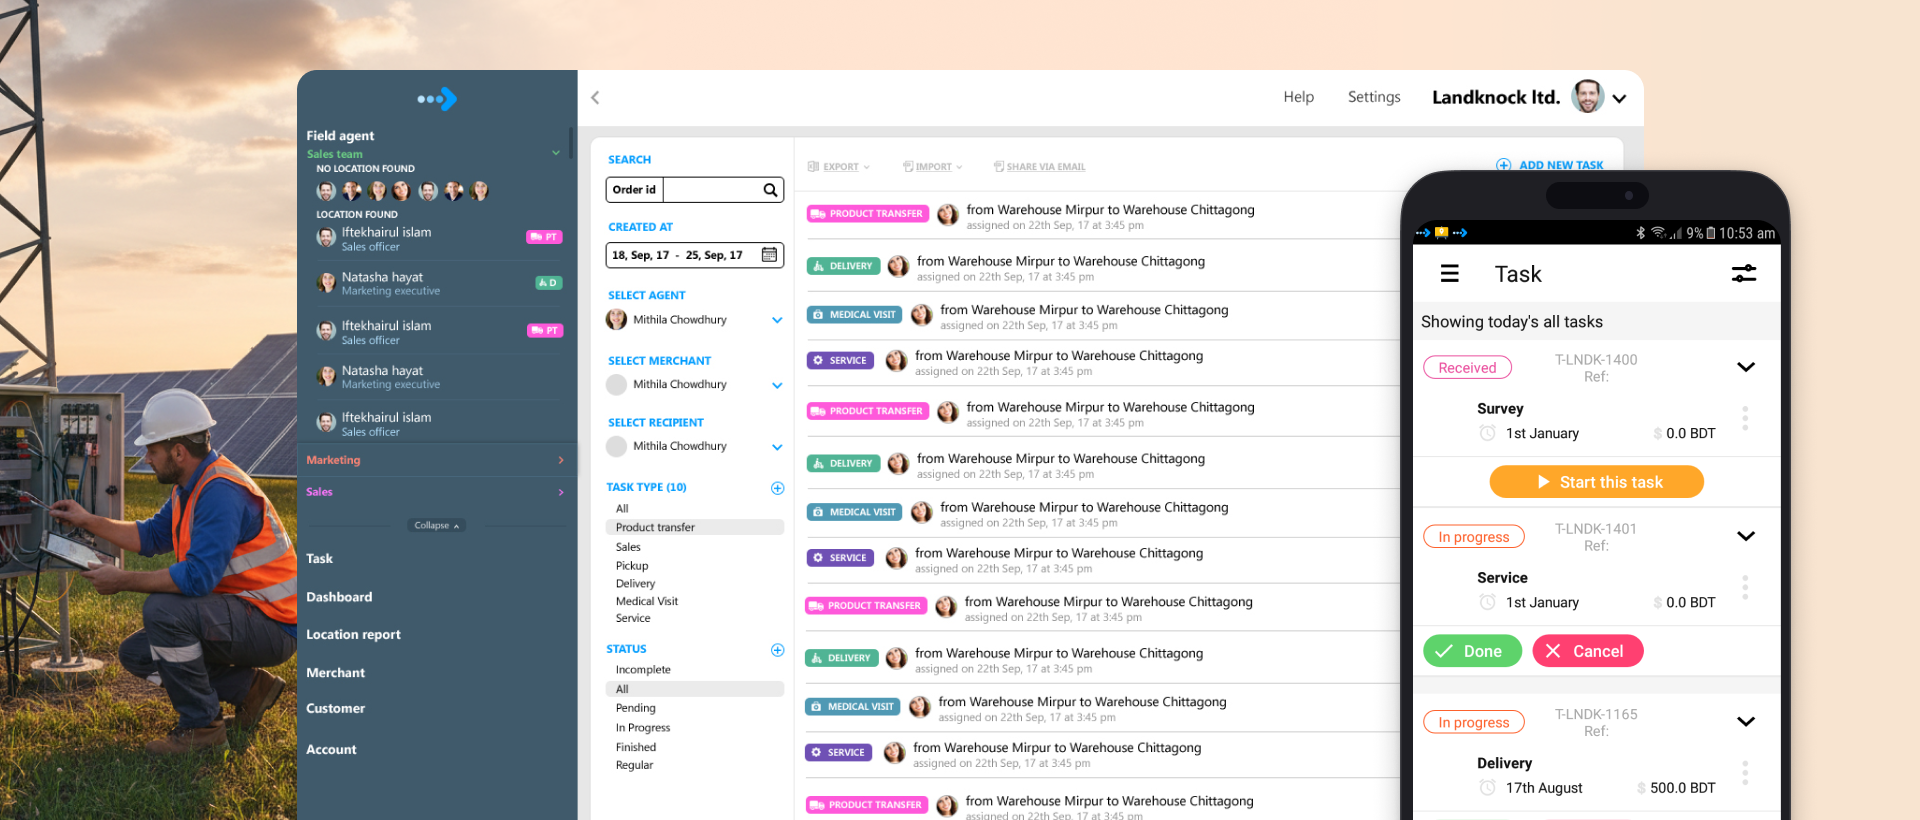
Organizations with people in the field had no way to see what those people were doing. Updates arrived late, and nobody could confirm a visit actually happened.
The idea began with Landfriends, the social app I had already designed, which showed friends on a map. Some of our clients and potential customers saw it and asked for the same kind of interface, a map where they could monitor their own field workers. That request is where the business idea came from. The stakeholders and I sat down together and decided to build a SaaS product around it.
Before designing anything, I wanted to know what the market actually wanted, so I went and talked to the people who would buy it. Across very different industries, they described the same gap. They used enterprise software to track sales and operations, but for field activity they relied on several separate sources and, at some points, on paper. Head office learned what happened in the field late, and had no reliable way to know whether field workers were visiting the places they were supposed to visit.
Goals
The goal was to increase transparency and gain visibility on what is happening on the field.
Every conversation added features that only one industry cared about. We let those go. The core challenge was to find where the problems overlapped and build only for that overlap. The product was about productivity, transparency and removing bottlenecks.
- More transparency between field and head office. Managers see what is happening; field workers have a way to show it.
- Higher field-worker productivity. Replace paper with a structured, step-by-step task flow.
- Real-time data access. No more waiting on delayed report. Management can access real-time data.
- Increased trust. Between the people watching and the people being watched. This goal turned out to be the hardest one.
Many Industries, One Platform
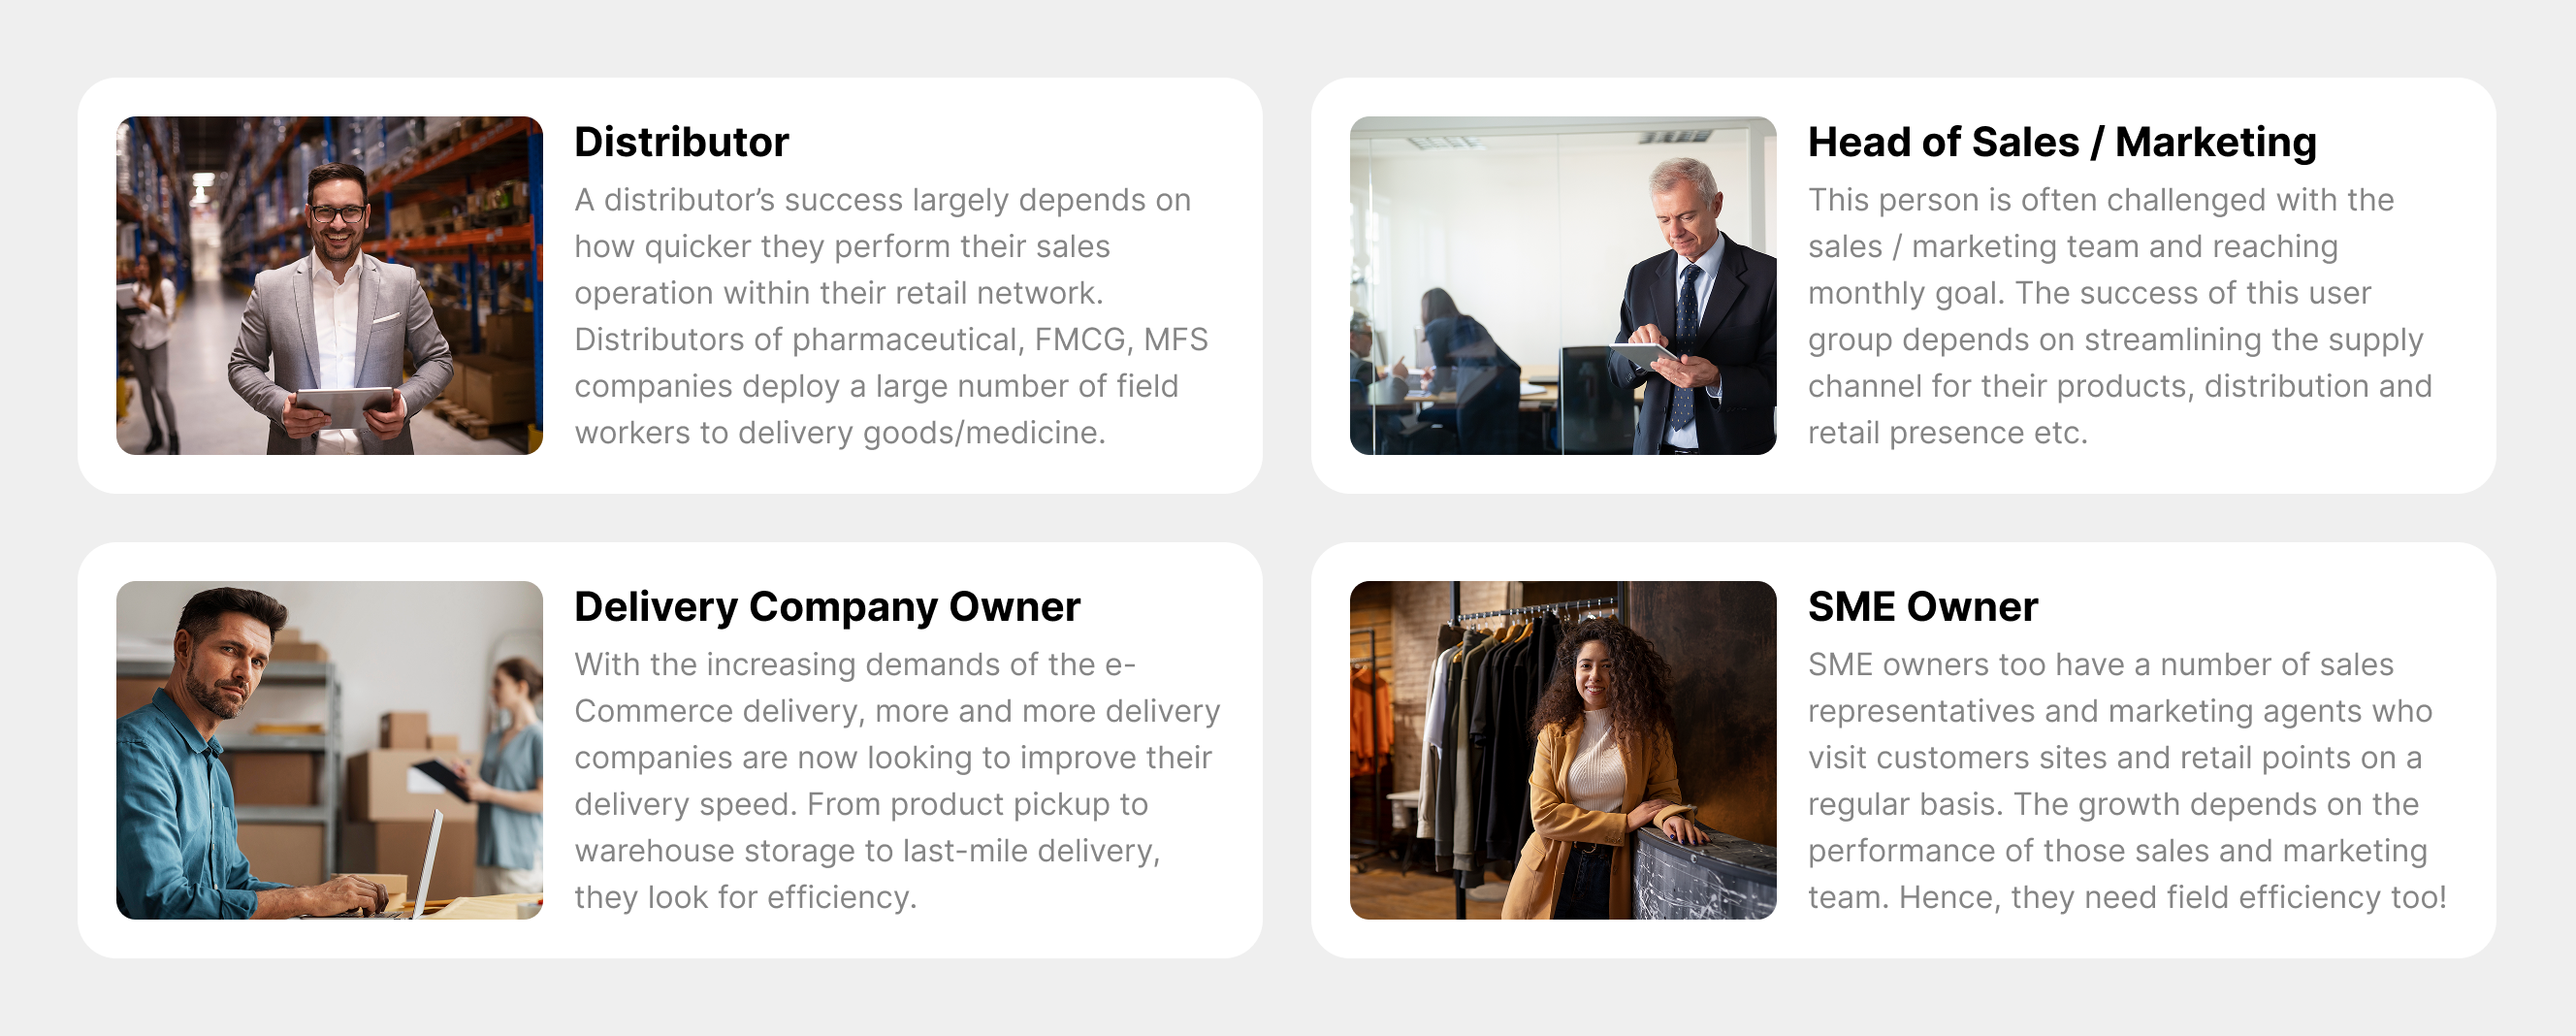
Four kinds of customer came out of the research: distributors, heads of sales and marketing, delivery company owners, and SME owners. Behind them sat banks, FMCG, pharma, telecom, logistics and service companies. The design question was how one platform could serve all of them without turning into four separate products.
Solution
A web app for head office, organized by hierarchy, and a fast, simple mobile app for the field.
A Hierarchy Decides What Each Person Sees
Once we decided the product would follow the customer's own hierarchy, everything else became much easier. Access runs from the national head down to the area manager, the last touch point. Everyone sees only the field activity that belongs to their level. A national head of sales sees the whole picture. A territory or regional manager sees only their own field.
Live Map and Route
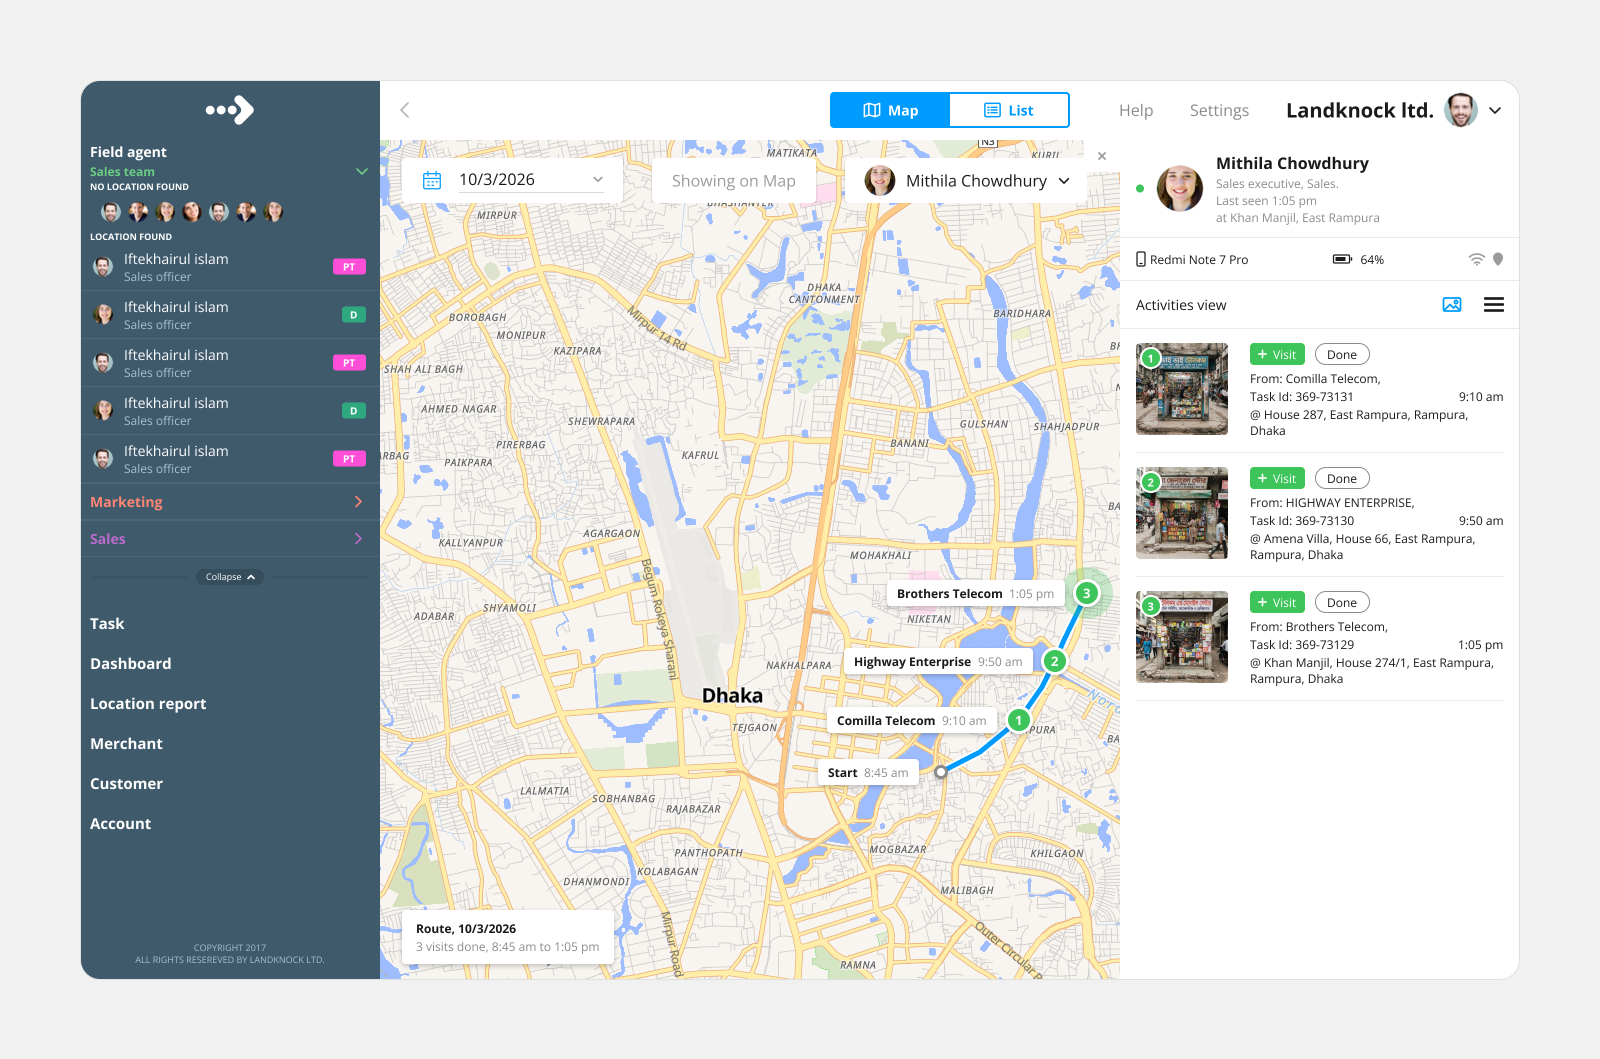
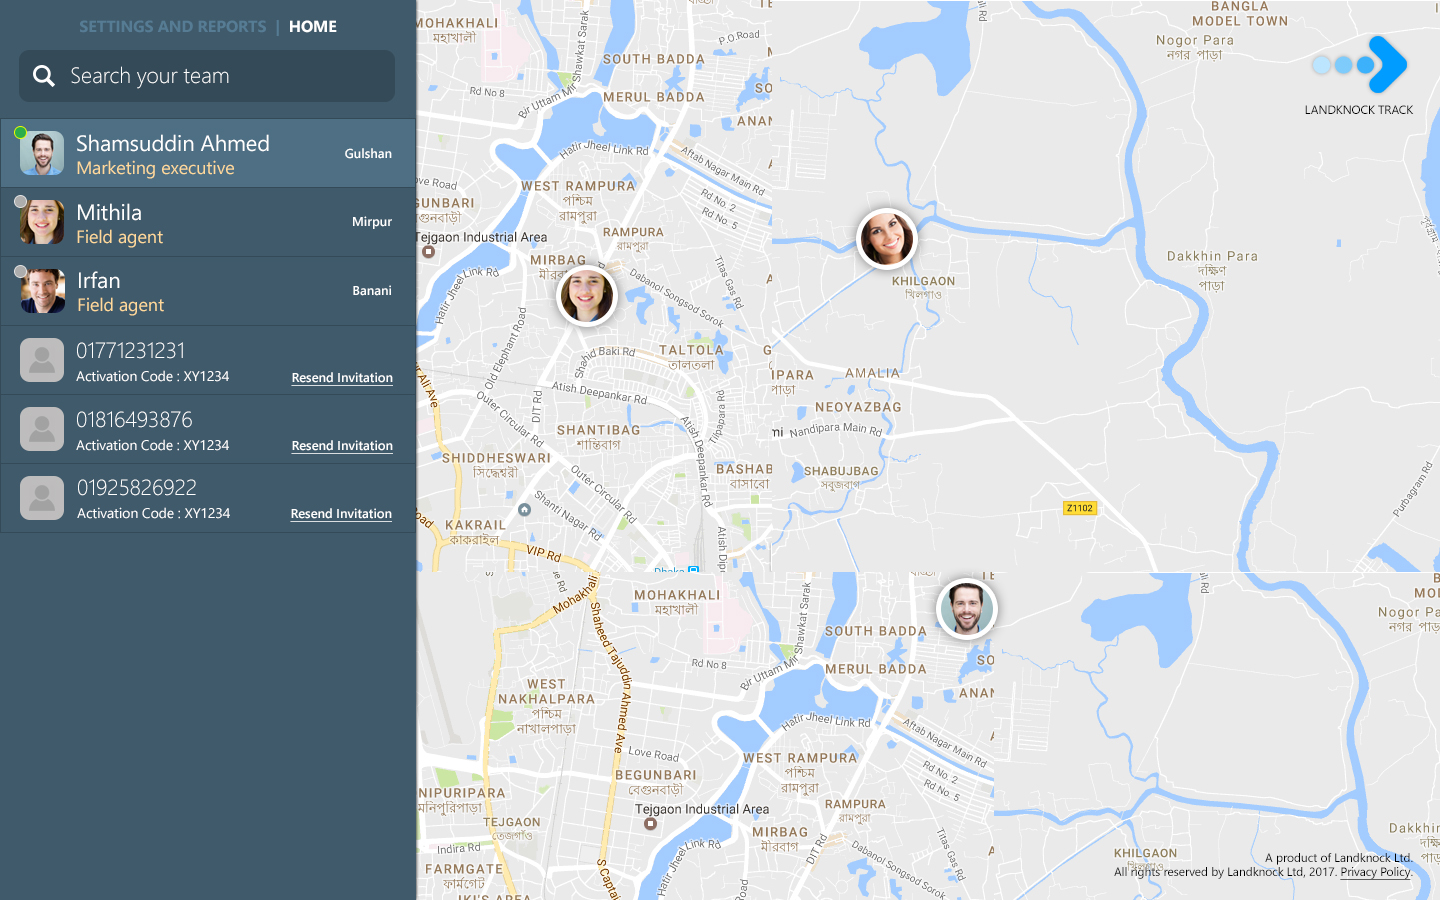
Managers follow each worker's visits and route through the day, as a map or a list.
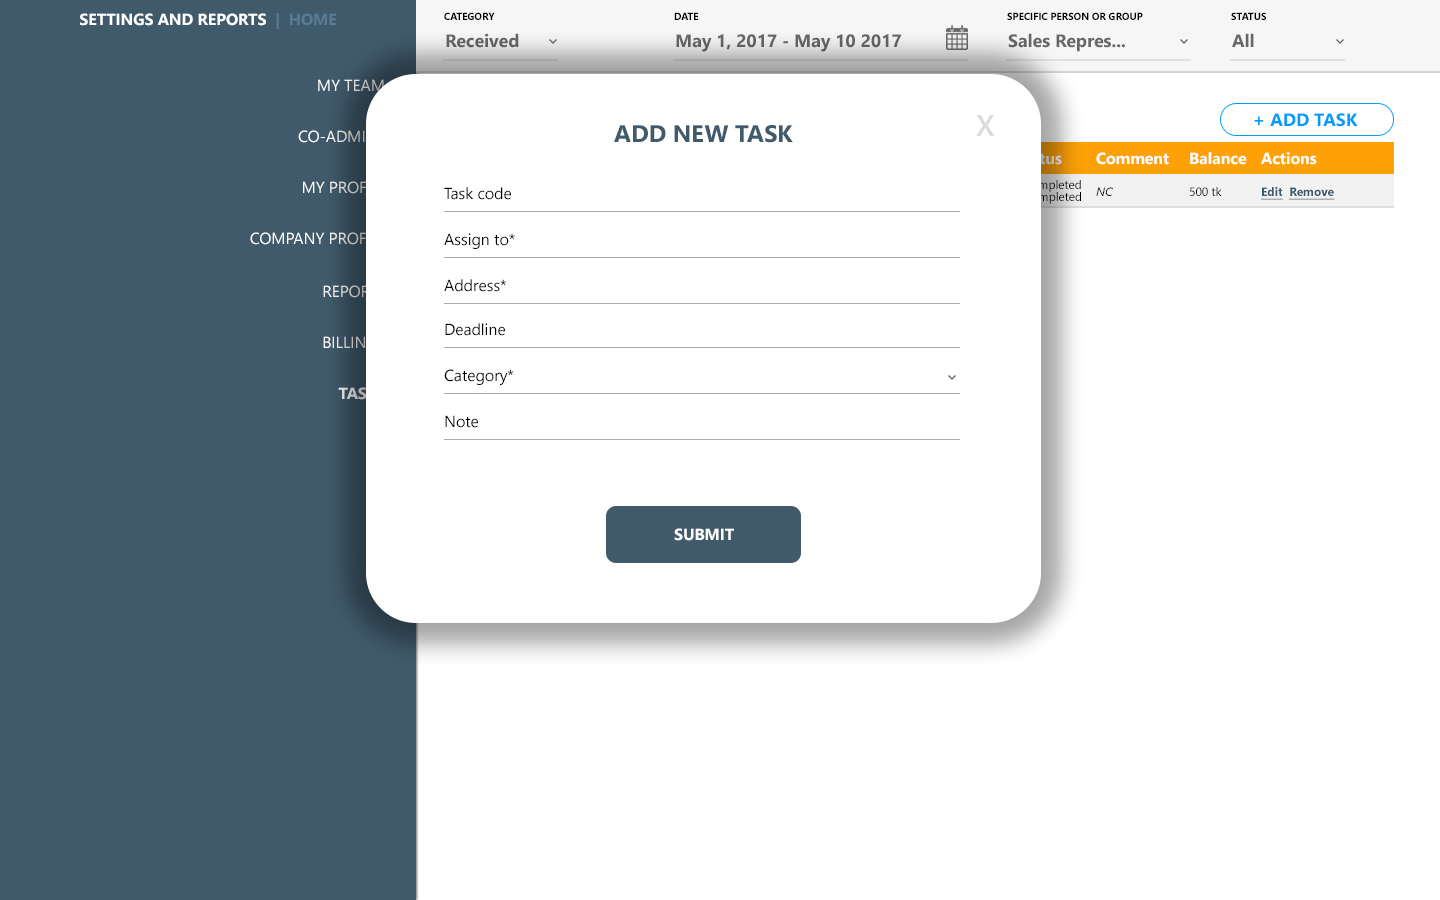
Task View
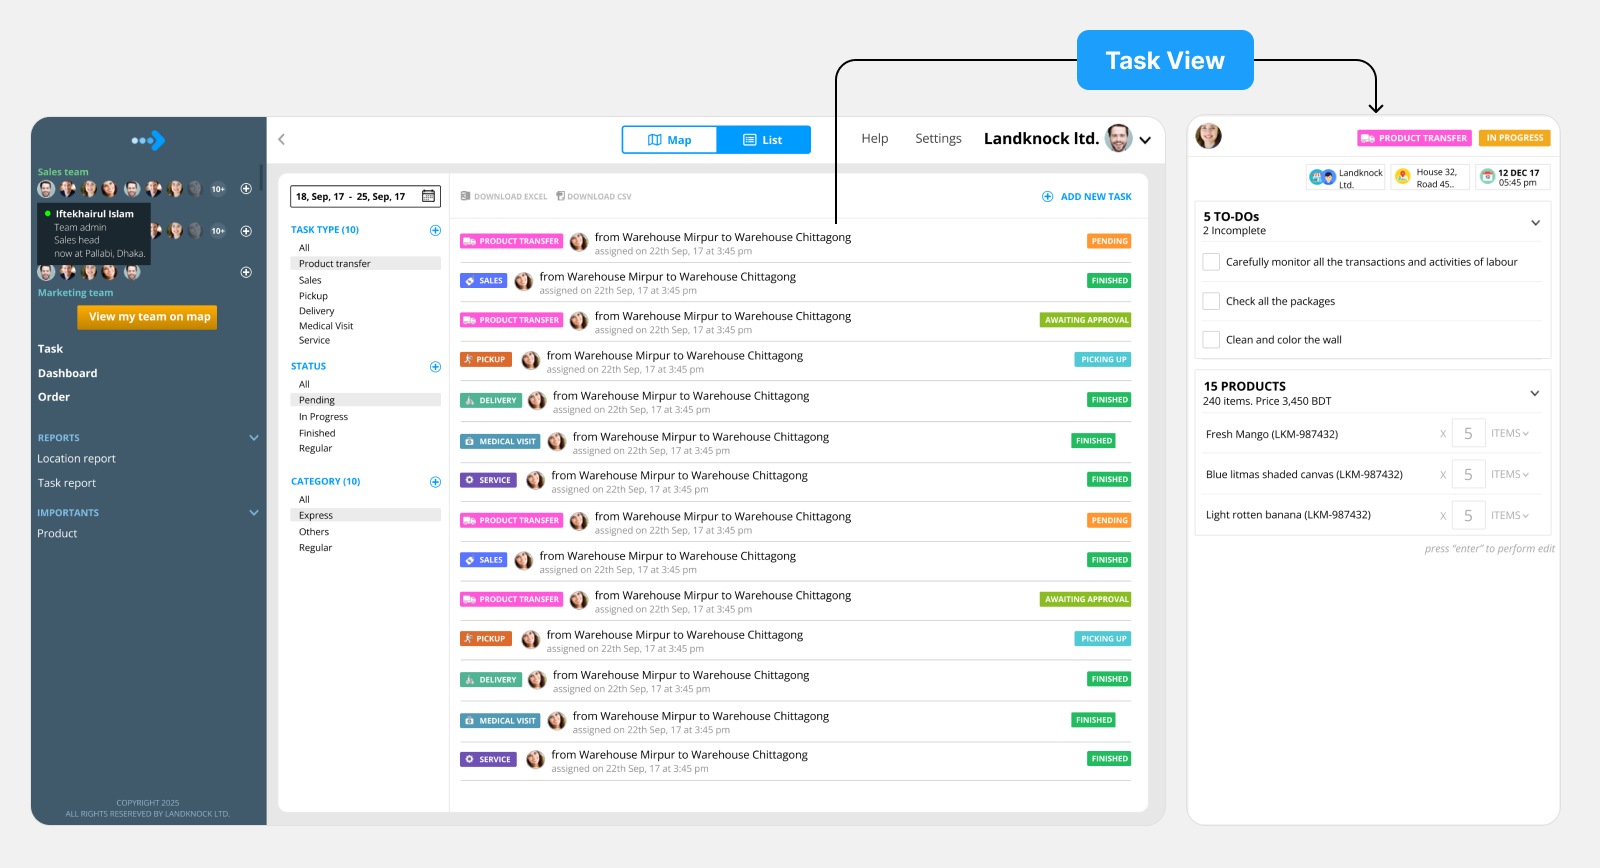
Managers assign tasks, filter them by type and status, and open any task to see its checklist and products.
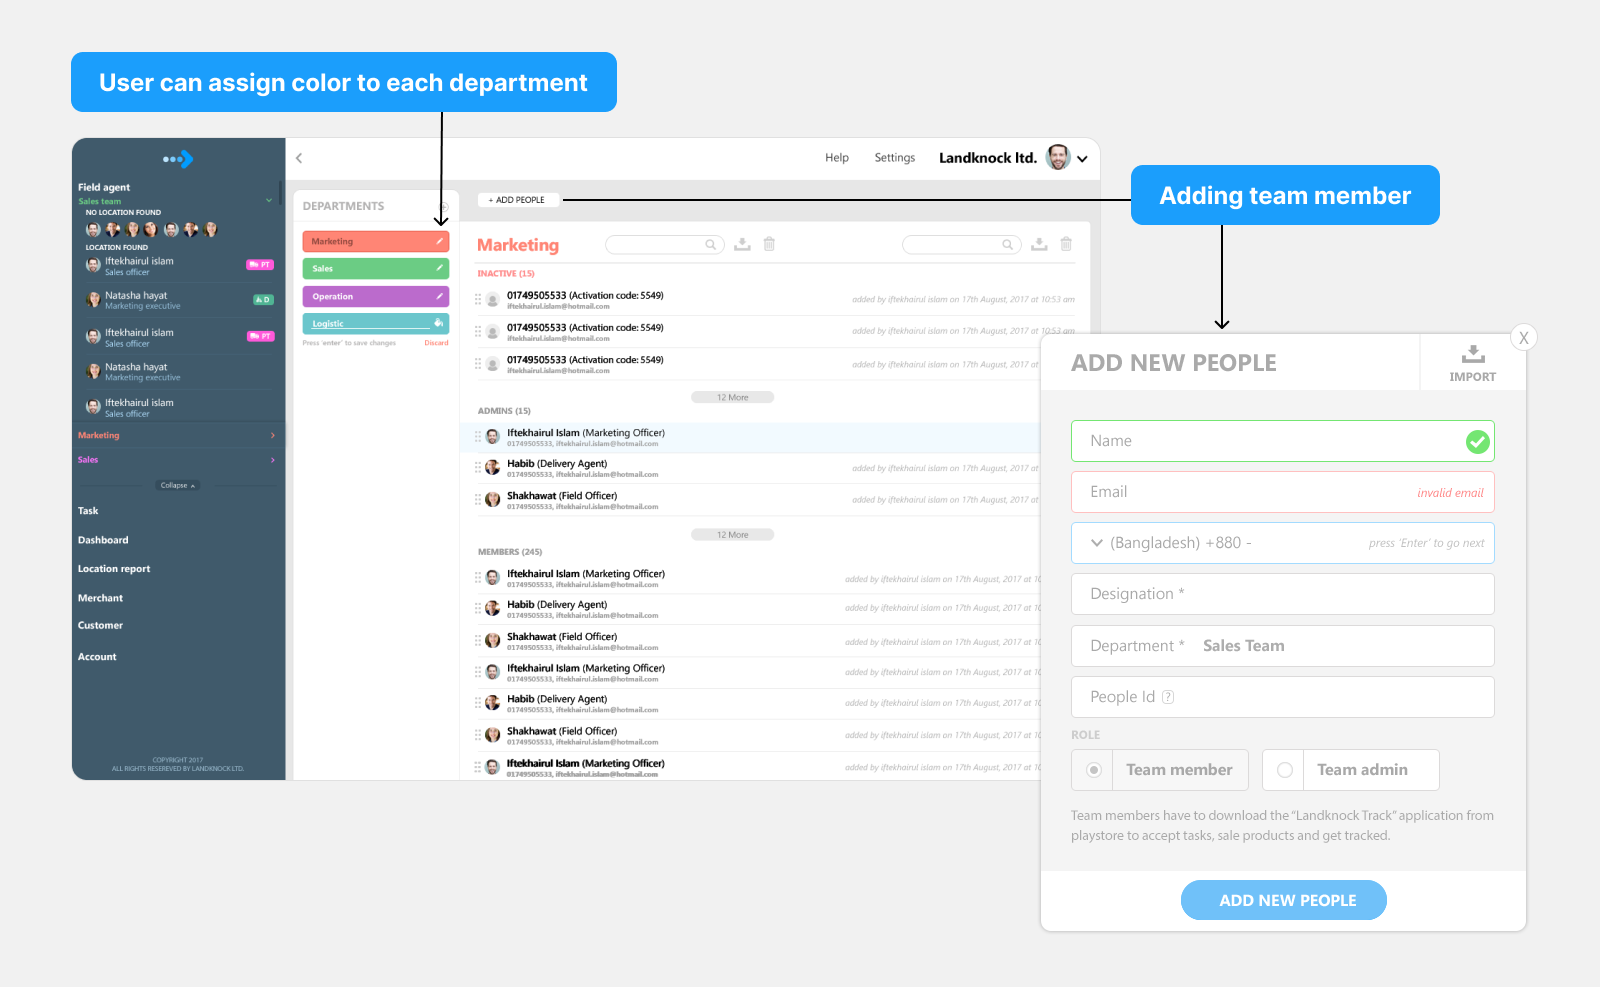
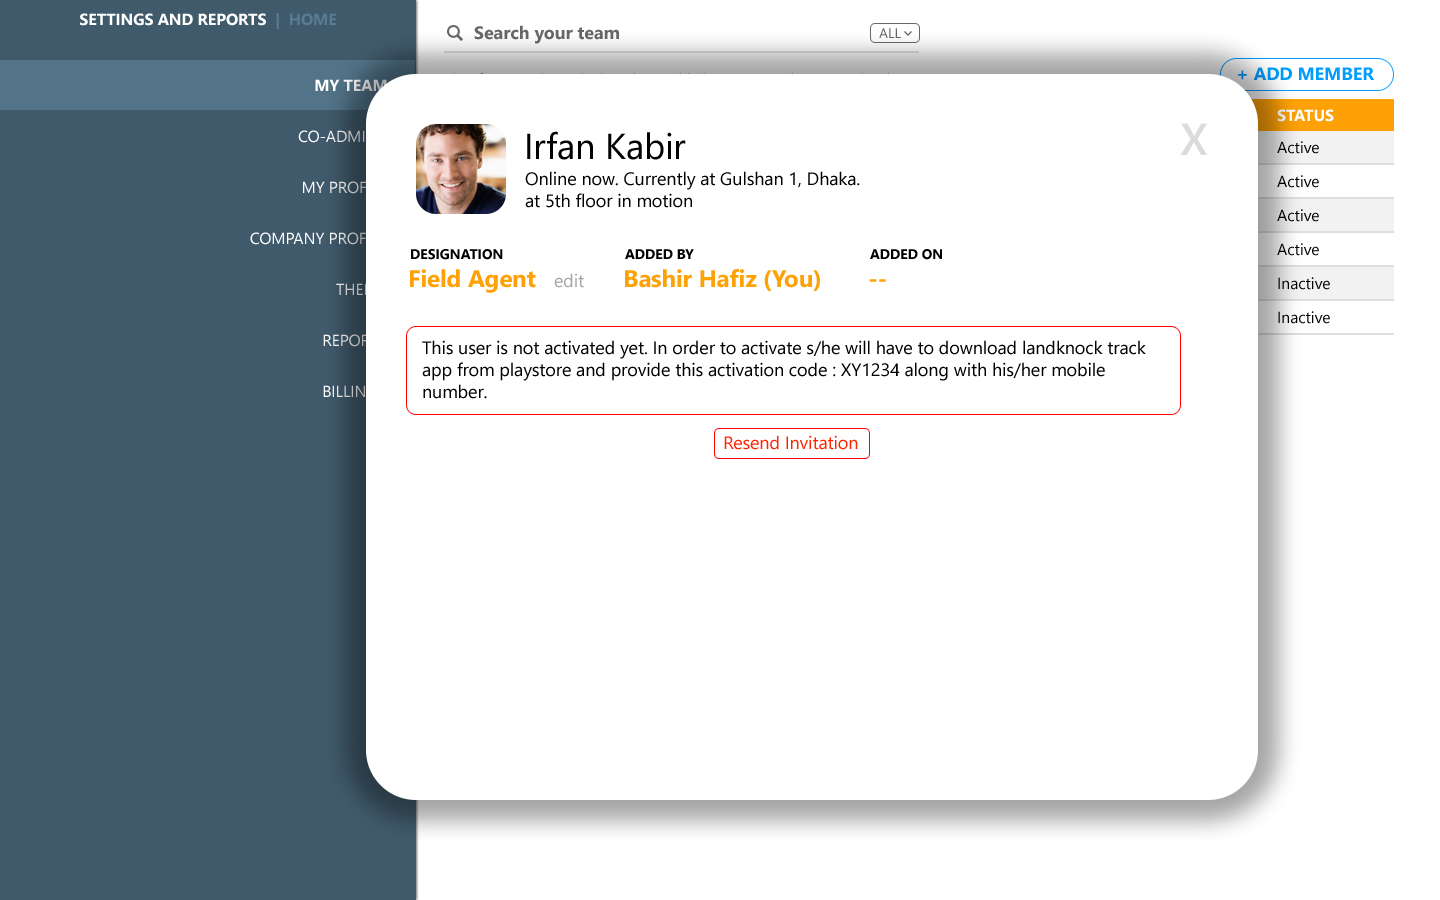
Adding a Team Member
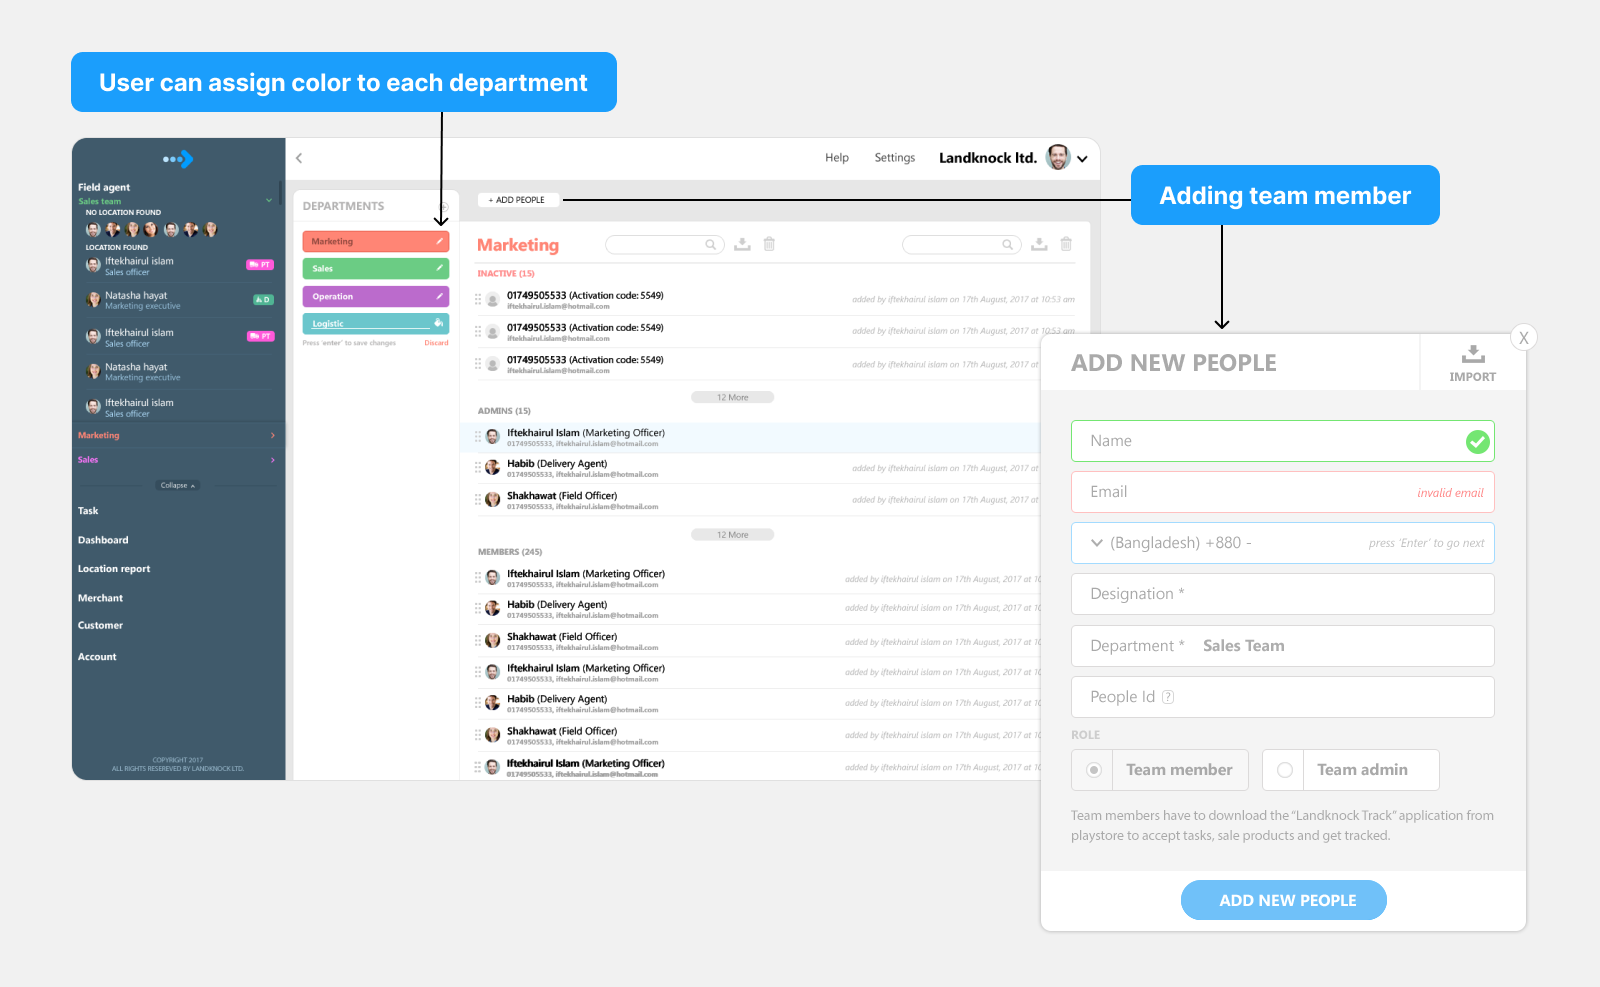
Admins add people to a team and give each department its own color.
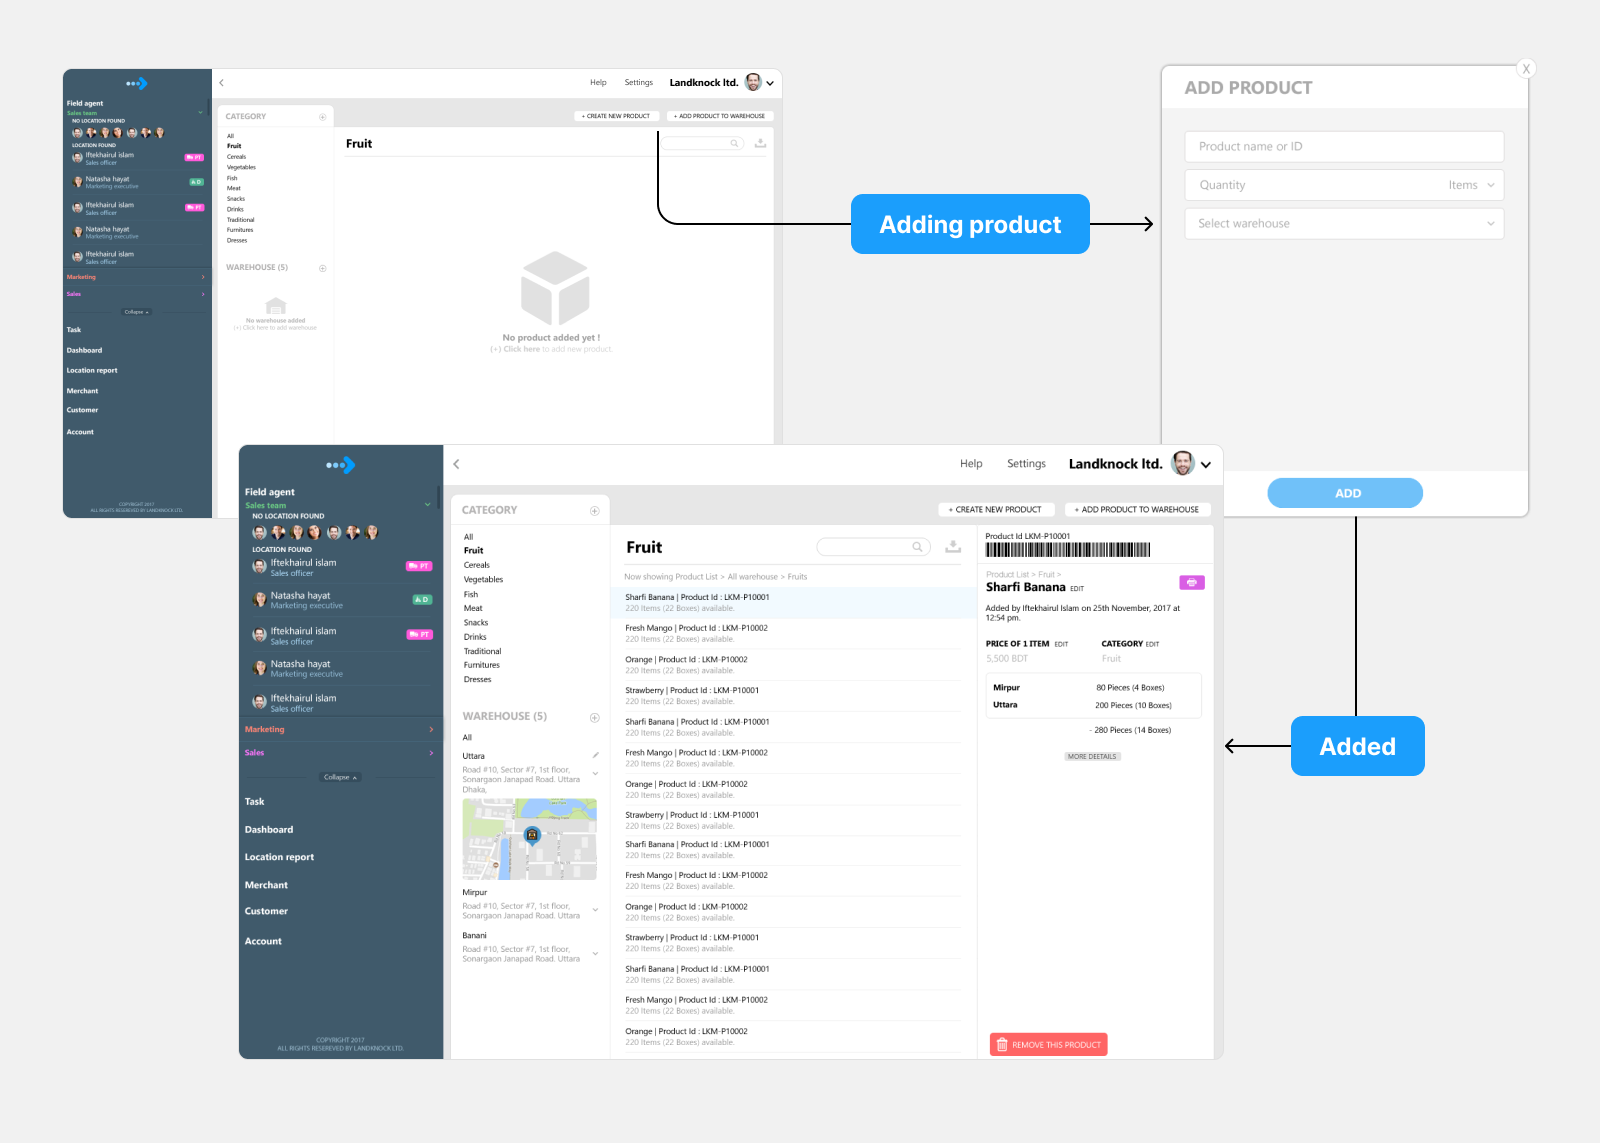
Adding Products
Add a product, assign it to a warehouse, and see it appear in stock.
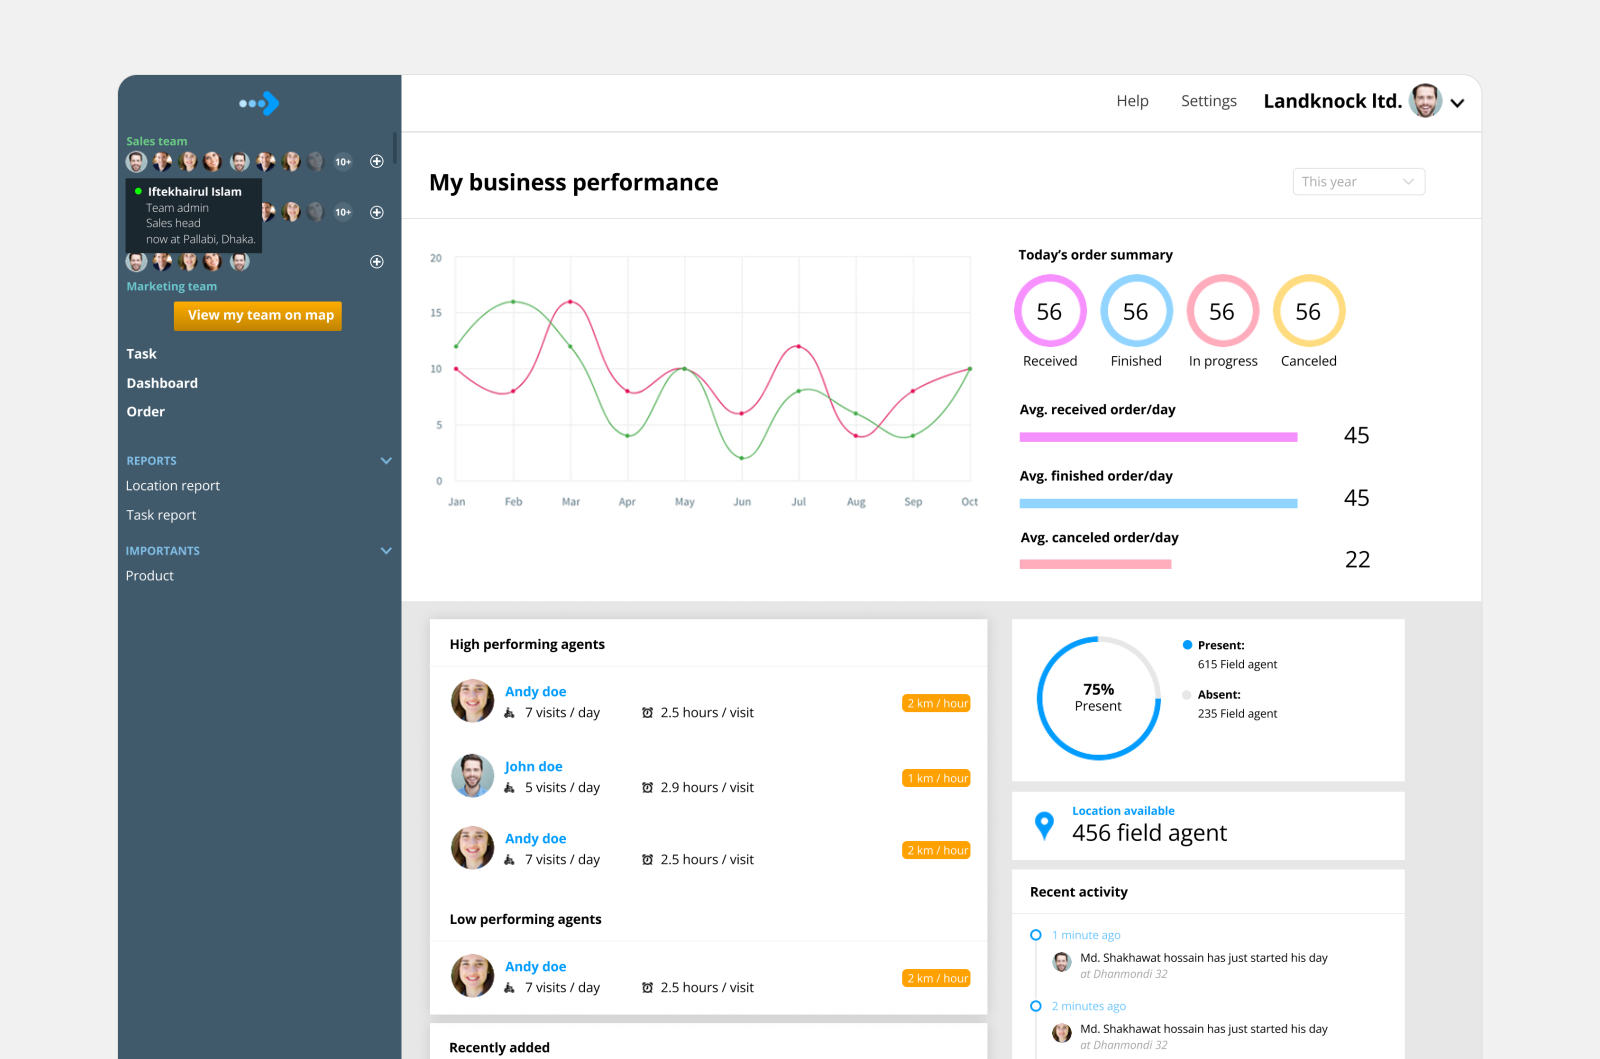
Business Dashboard
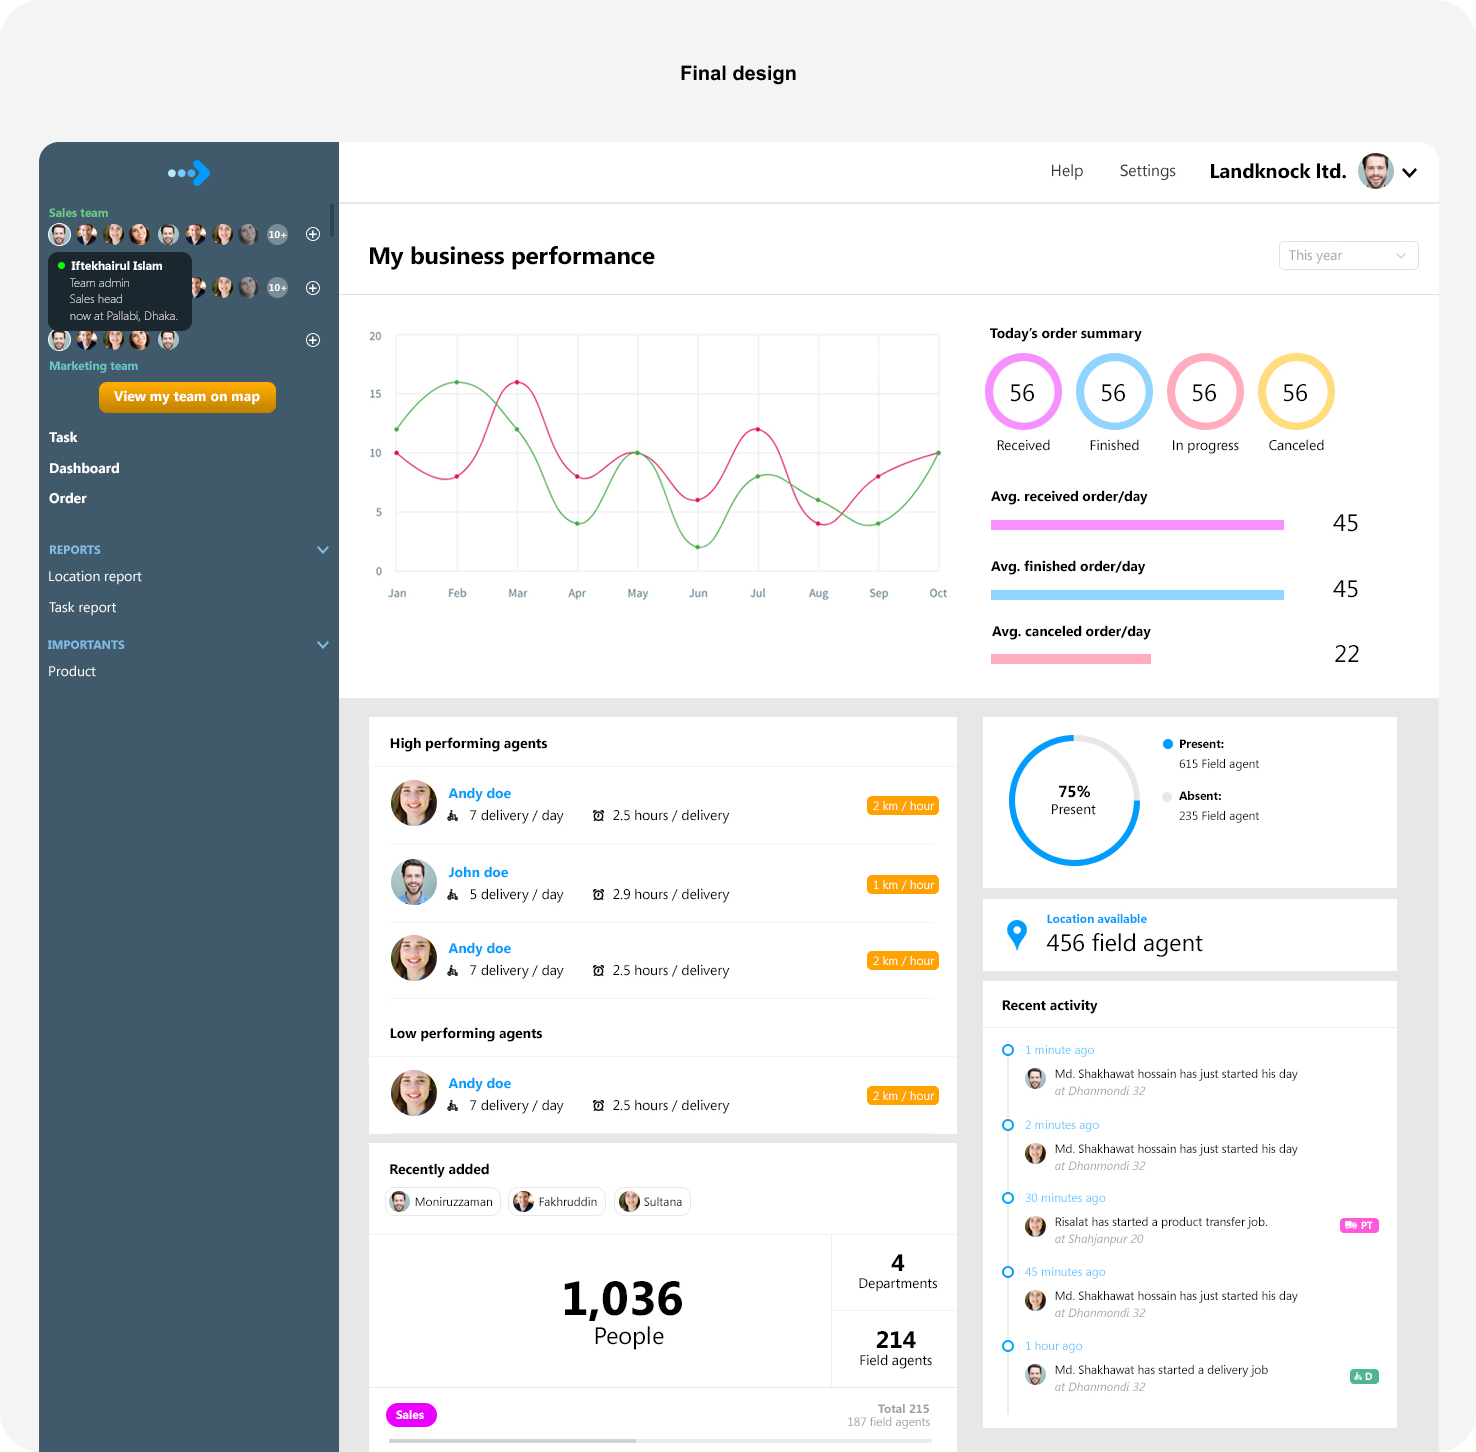
Order status, top and low performing agents, attendance and recent activity on one page.
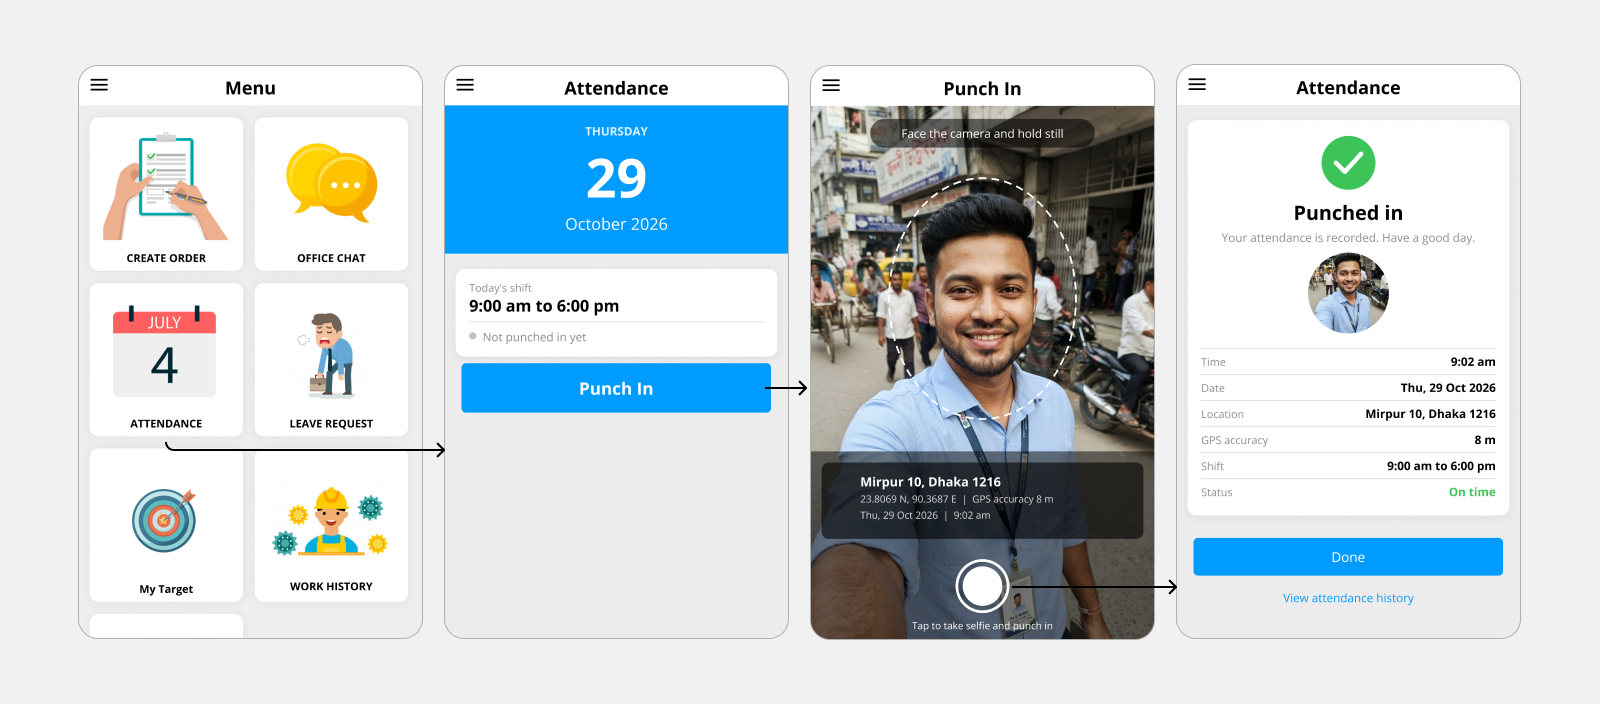
Attendance
A field worker punches in with a selfie that carries a location stamp.
Create Order
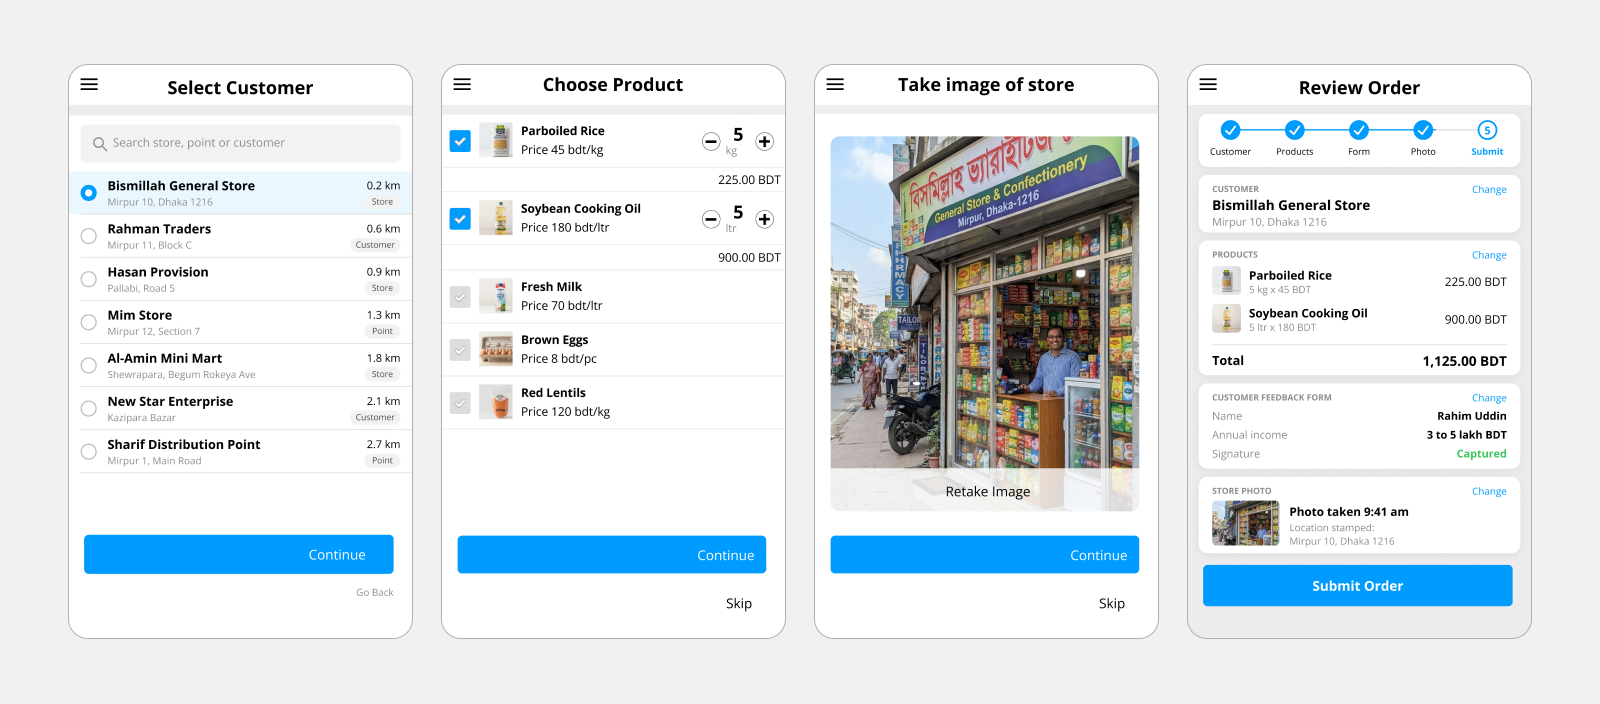
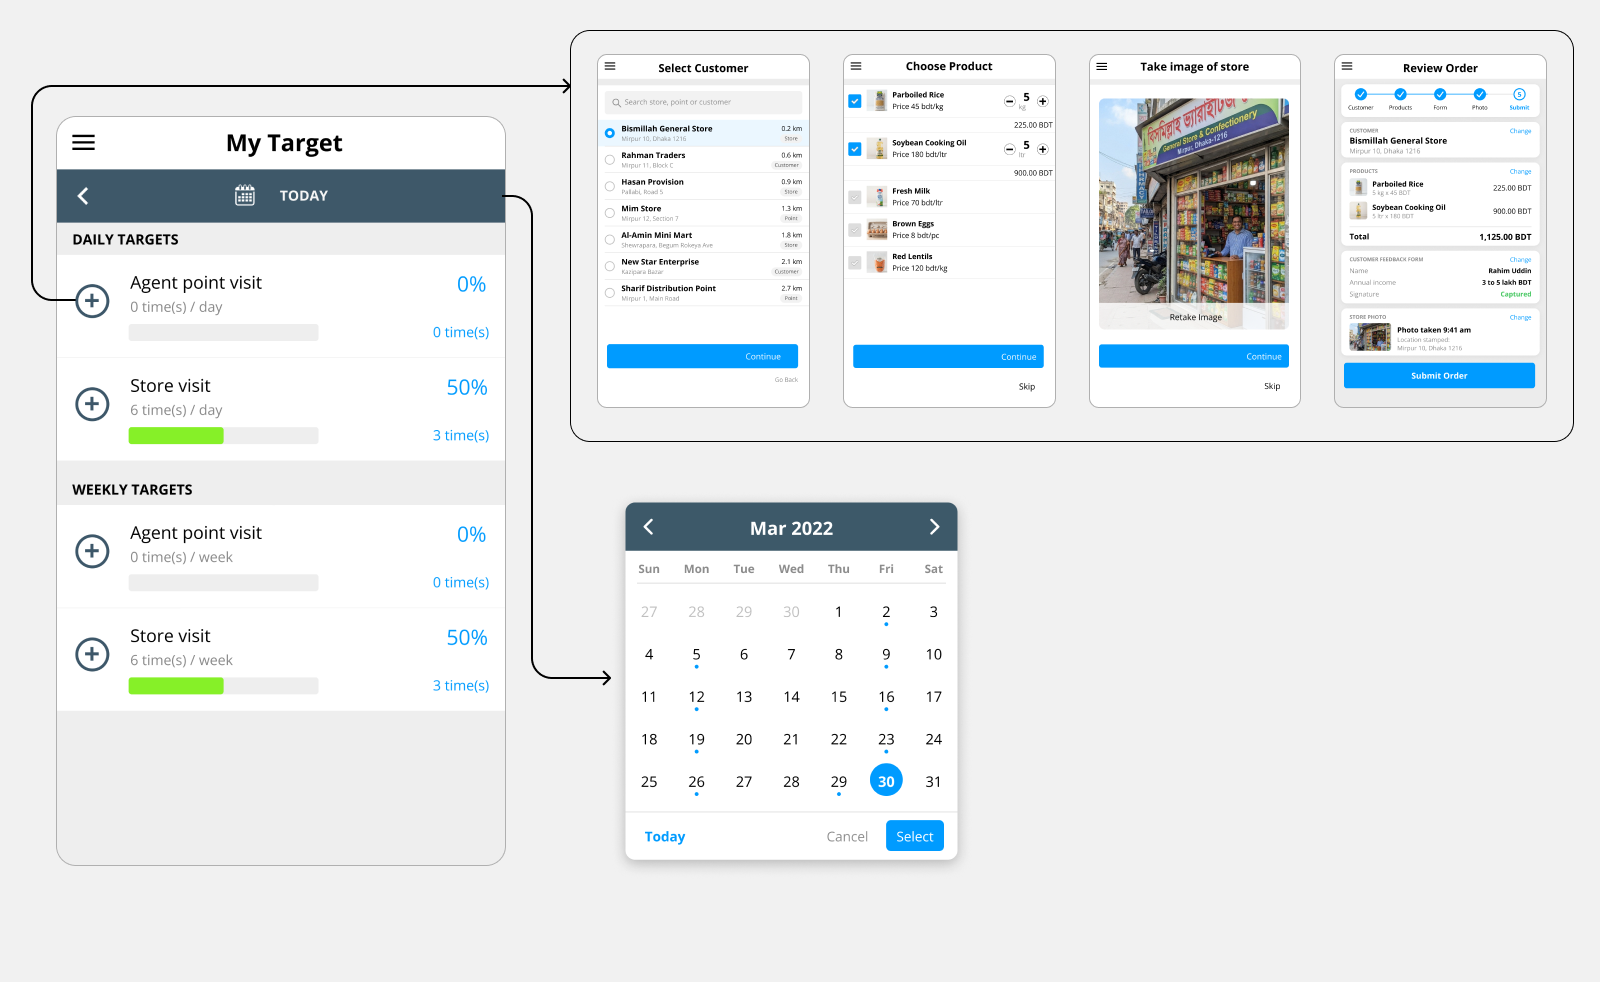
Pick a customer, choose products, add a store photo, then review everything and submit.
Impact
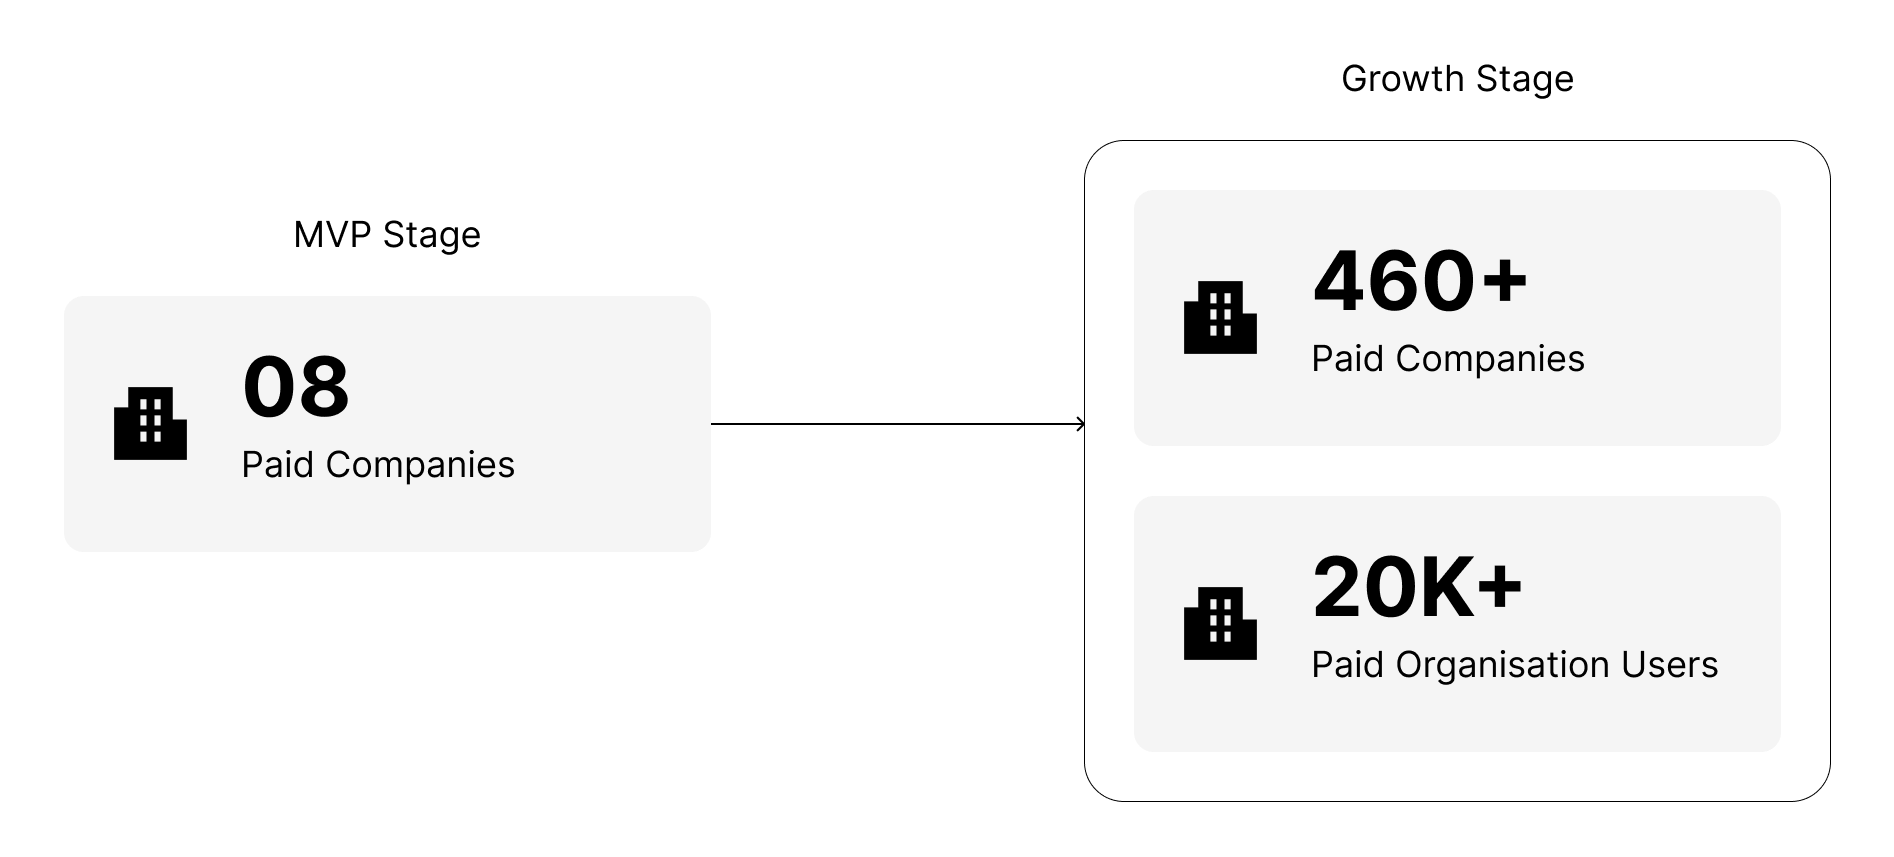
We launched the MVP in 60 days and onboarded one large commercial bank, one nationwide distributor and six companies from other industries. That told us the problem and the solution were right. The platform then grew to 460+ companies and 20,000+ organization users over the next 24 months. We measured "task completion rate" across 5 companies in different industries and found that, on average, field teams went from visiting 9 locations a day to 12. That is roughly a 33% increase in productivity.
Research
Executives were hard to reach
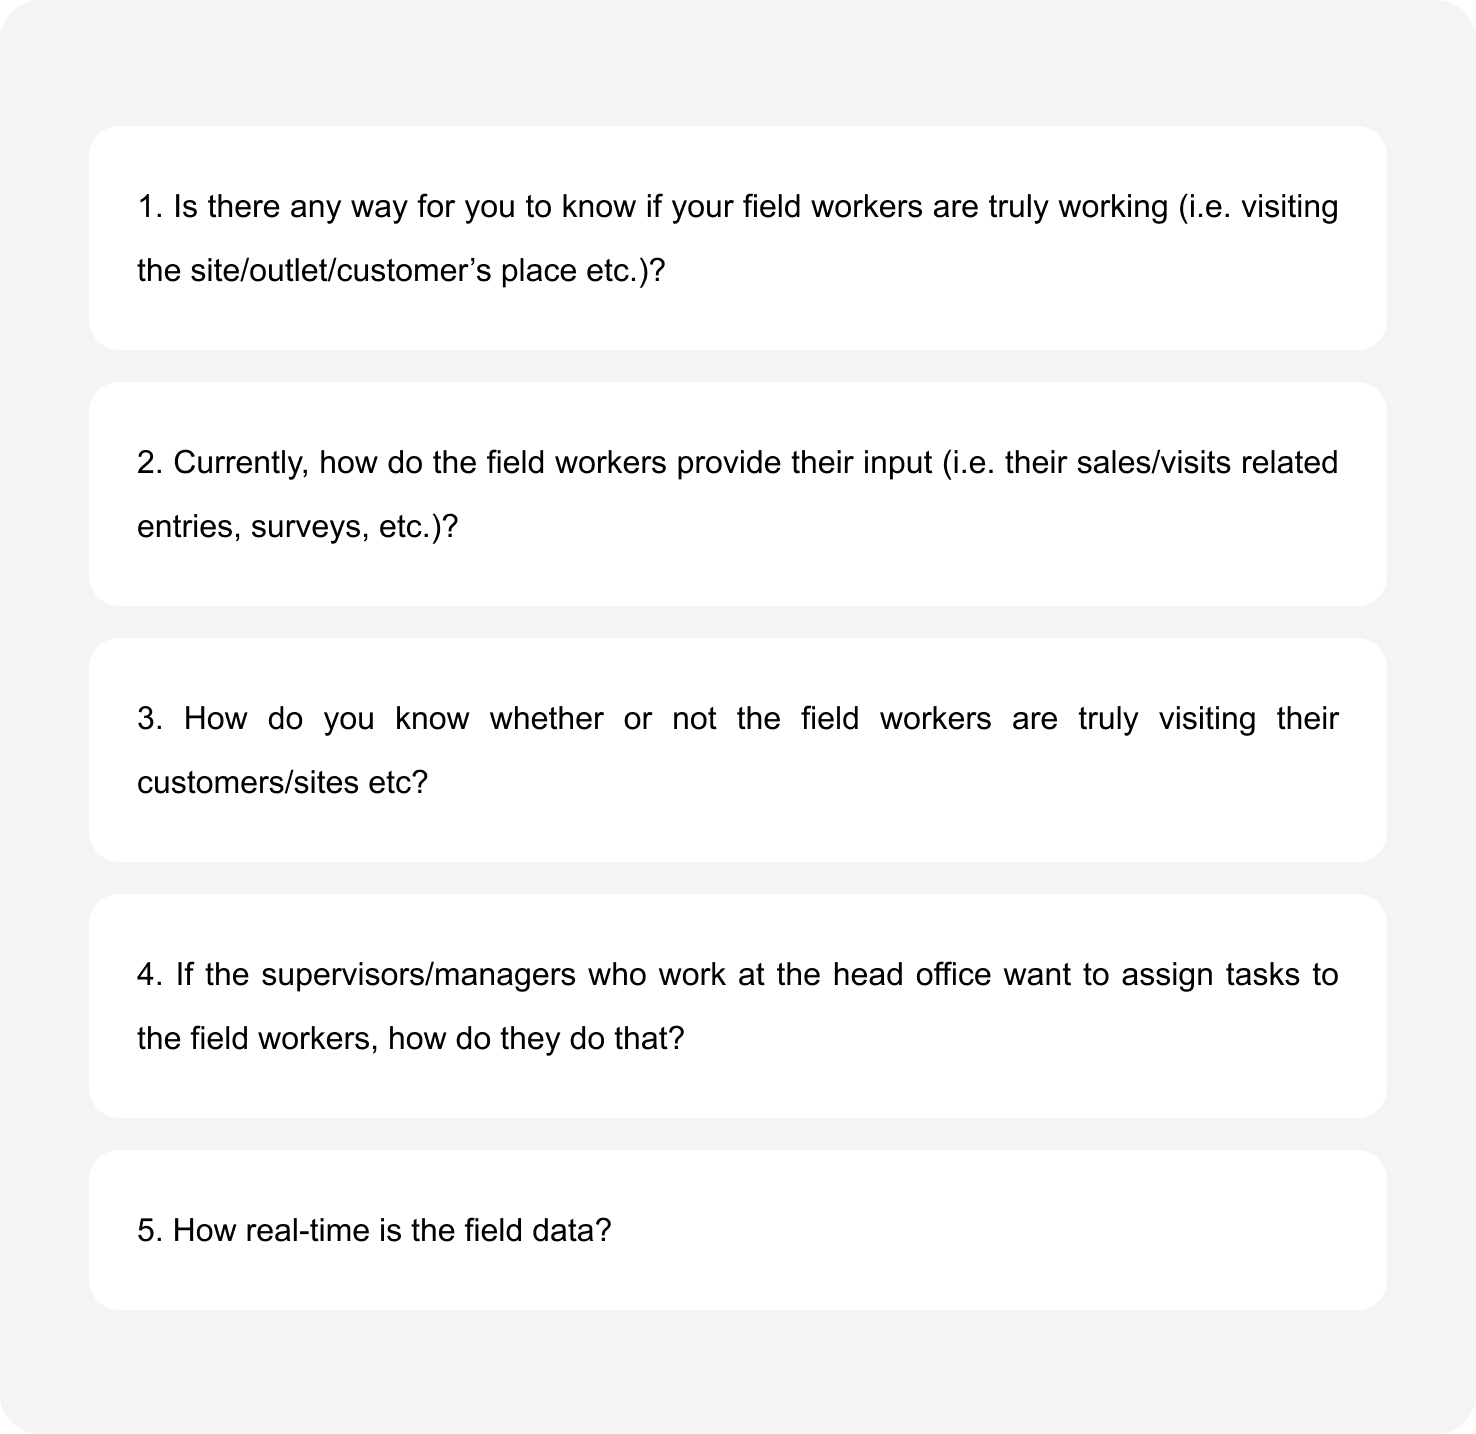
Forms such as Google Forms and SurveyMonkey did not work for this audience. I reached owners and department heads through personal network introductions, and roughly 1 in 30 cold contacts agreed to a session. The first round was about 6 interviews. As the product grew I kept going, and the total reached 15 to 20. The people I spoke with included people from supply chain, heads of sales and marketing, distributors, executives at banks and other financial organizations, leaders in logistics and transportation, telecom leaders, and owners of service companies.
The answers overlapped across industries. Nobody had visibility of what was happening in the field. Their updates arrived late. They had no way to confirm whether field workers were actually visiting the field. They relied on multiple sources and, at some points, on paper. Some executives also named competitors they already knew about but were not using, because the pricing did not work for them. There was no single comparable product to draw from, since the target was several industries at once.
Ideation
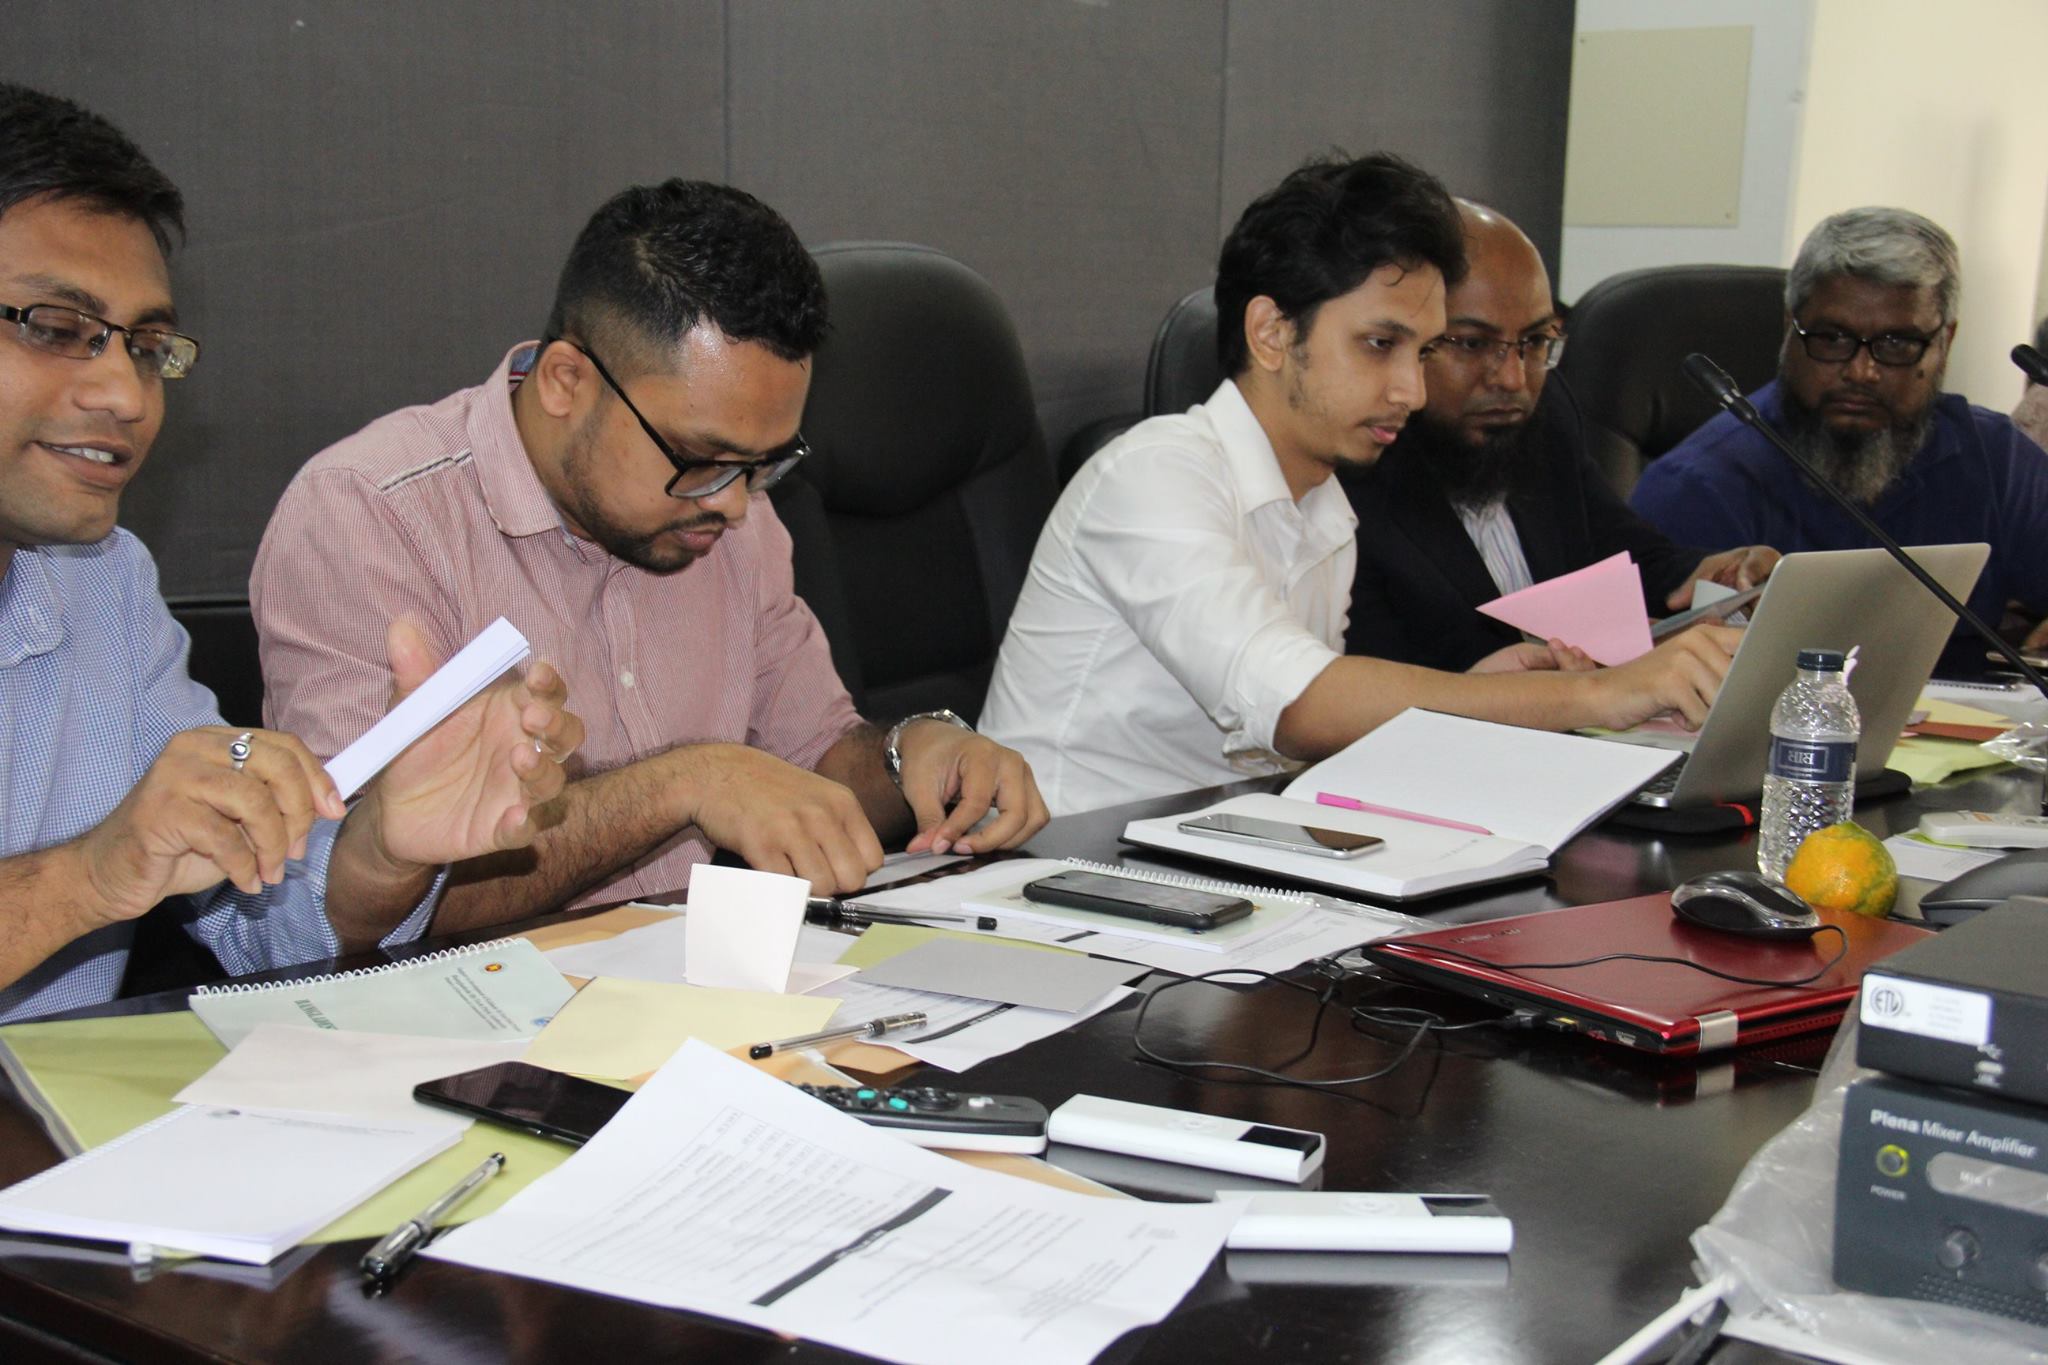
After the interviews, we sat together and turned what we heard into a feature list.
Brainstorming and Feature Shortlisting
We sat together, brainstormed, and synthesized features from what executives told me. Features that mattered to only one industry were dropped. What was left served every industry we had spoken to.
The Feature List
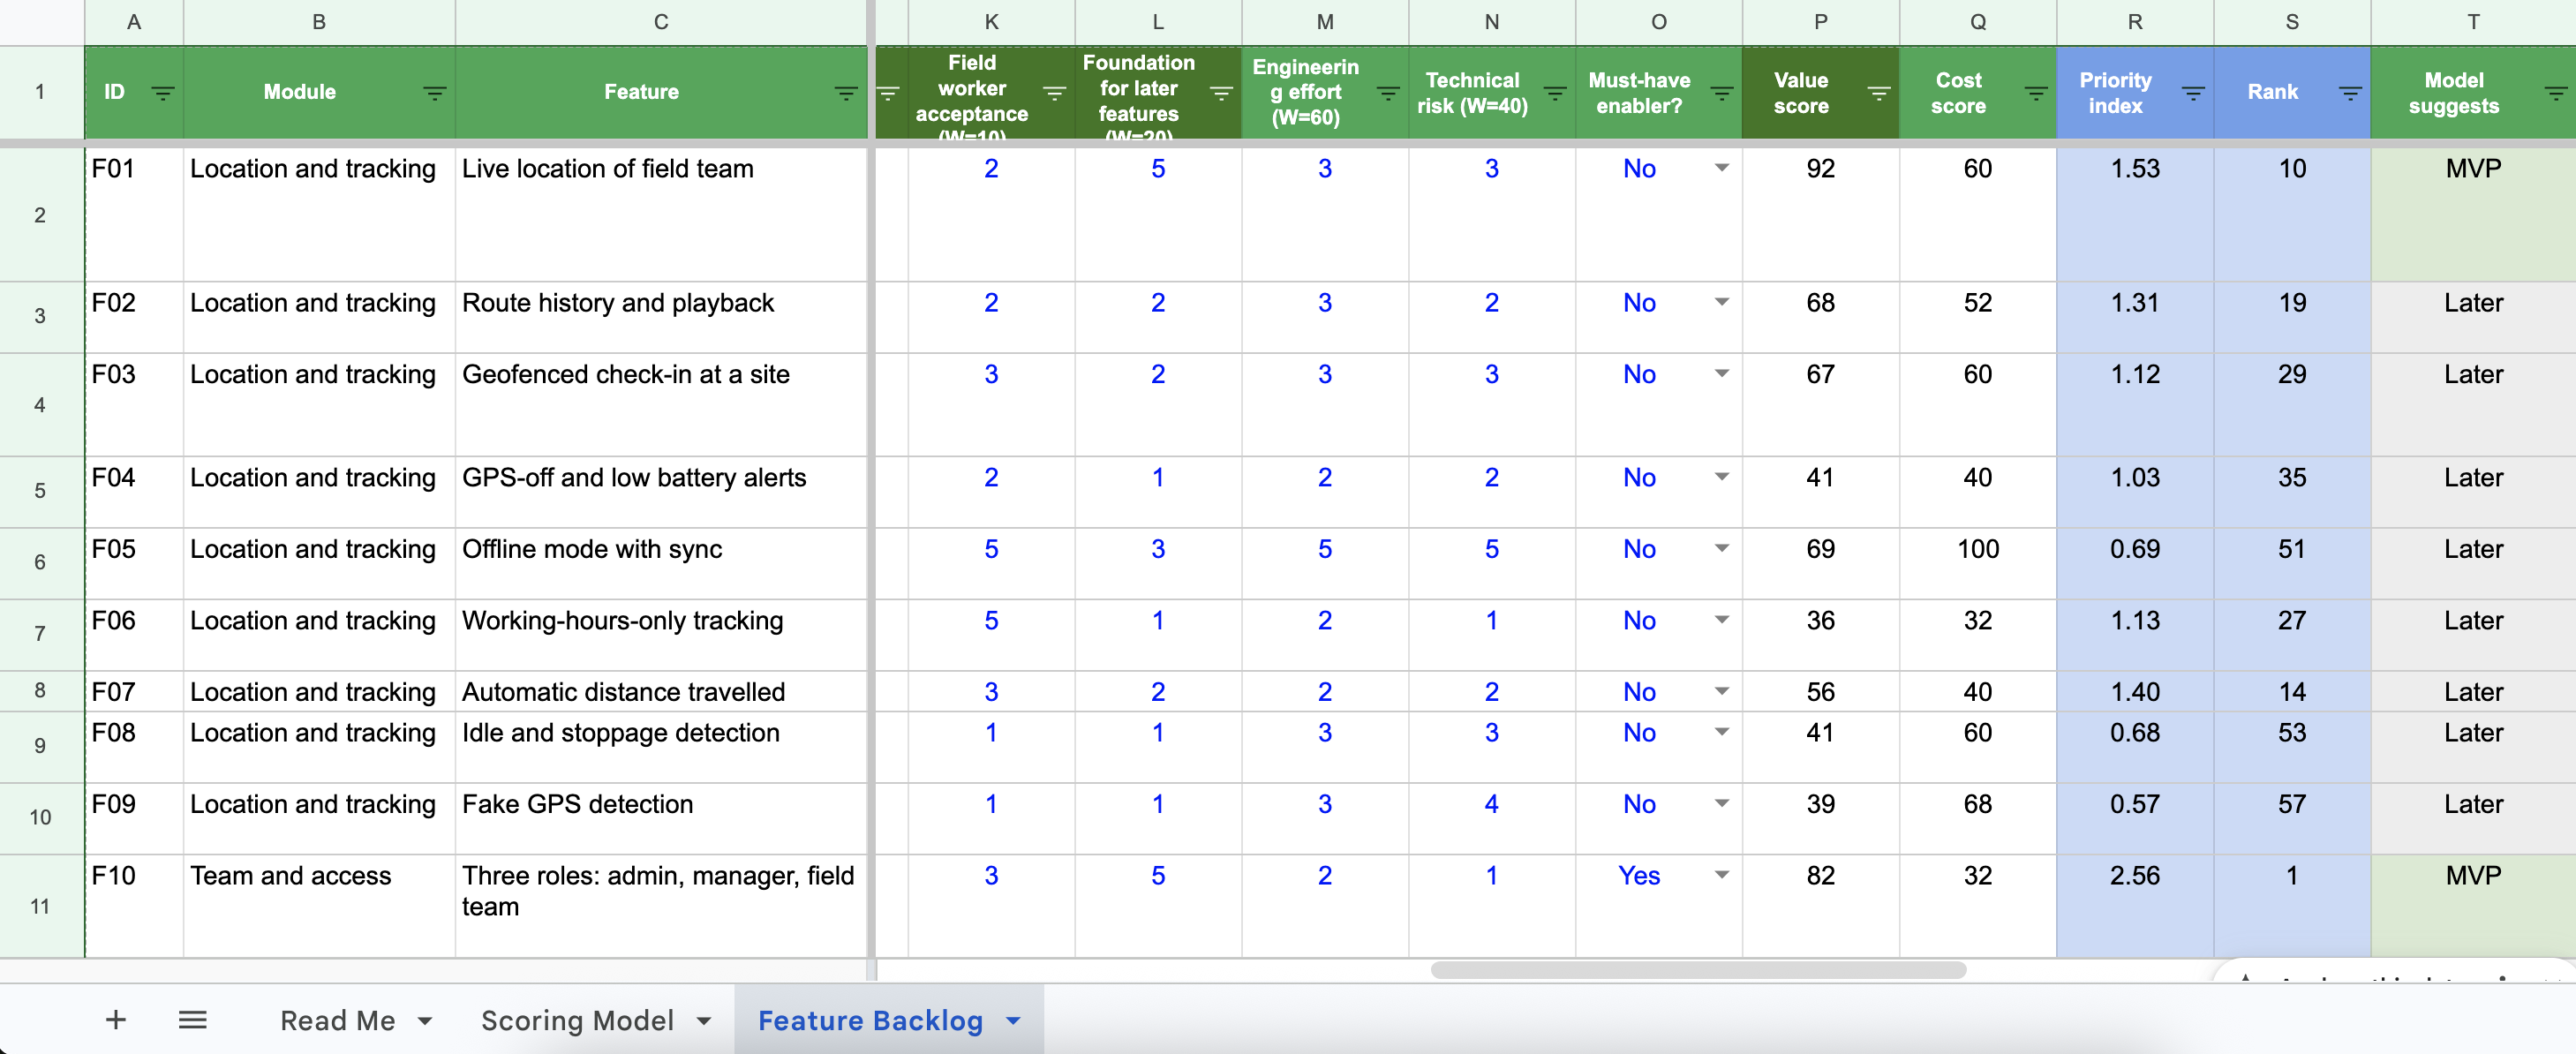
The shortlist became a feature list. Each feature was scored on value, engineering effort and technical risk, and the ones that other features depend on were flagged as must-haves.
MVP
We had a huge feature list. Team wanted to build the whole product. I pushed for an MVP build first. Because at that point, everything was hypothetical. As a big advocate of "Lean UX" myself, I wanted to build something first and validate it.
The MVP went out in 60 days. It was built to answer one question: does this actually serve the market, and can we onboard real users?
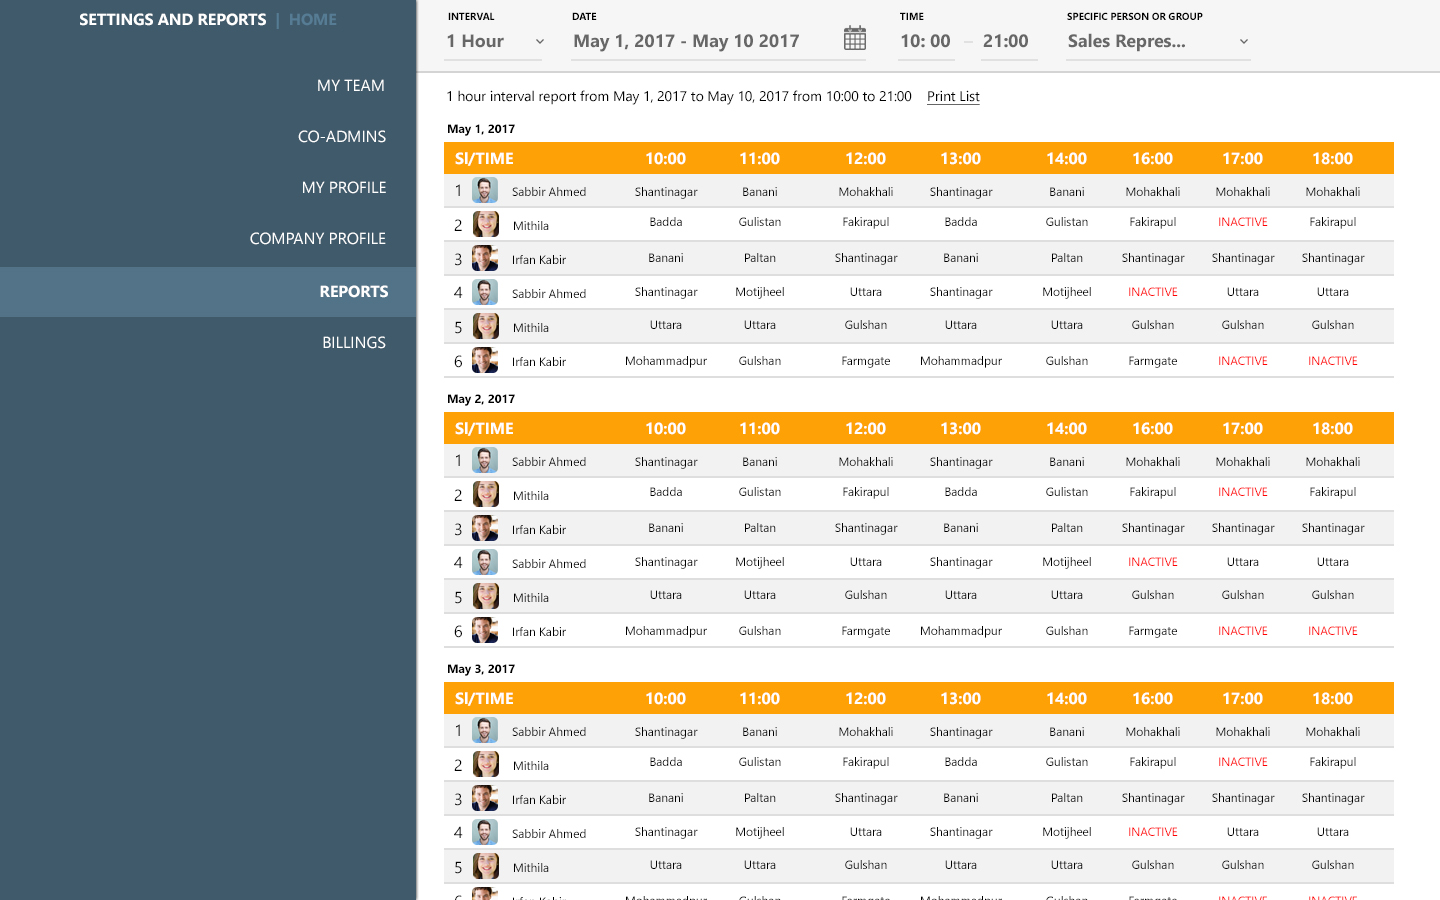
As a founding member and the lead designer, I argued that building the whole product before knowing anyone would pay was the more expensive way to find out. It saved roughly 6 months of build time. Landfriends had just ended on funding runway, and I did not want to make that mistake twice.
The MVP onboarded the bank, the distributor and six other companies. The problem we had found and the solution we had chosen were valid. That was when the first real problem began.
Final Design
The final design is where the MVP's lessons landed: the wireframes, the decisions behind them, and the changes we made after launch.
Sketching & Wireframes
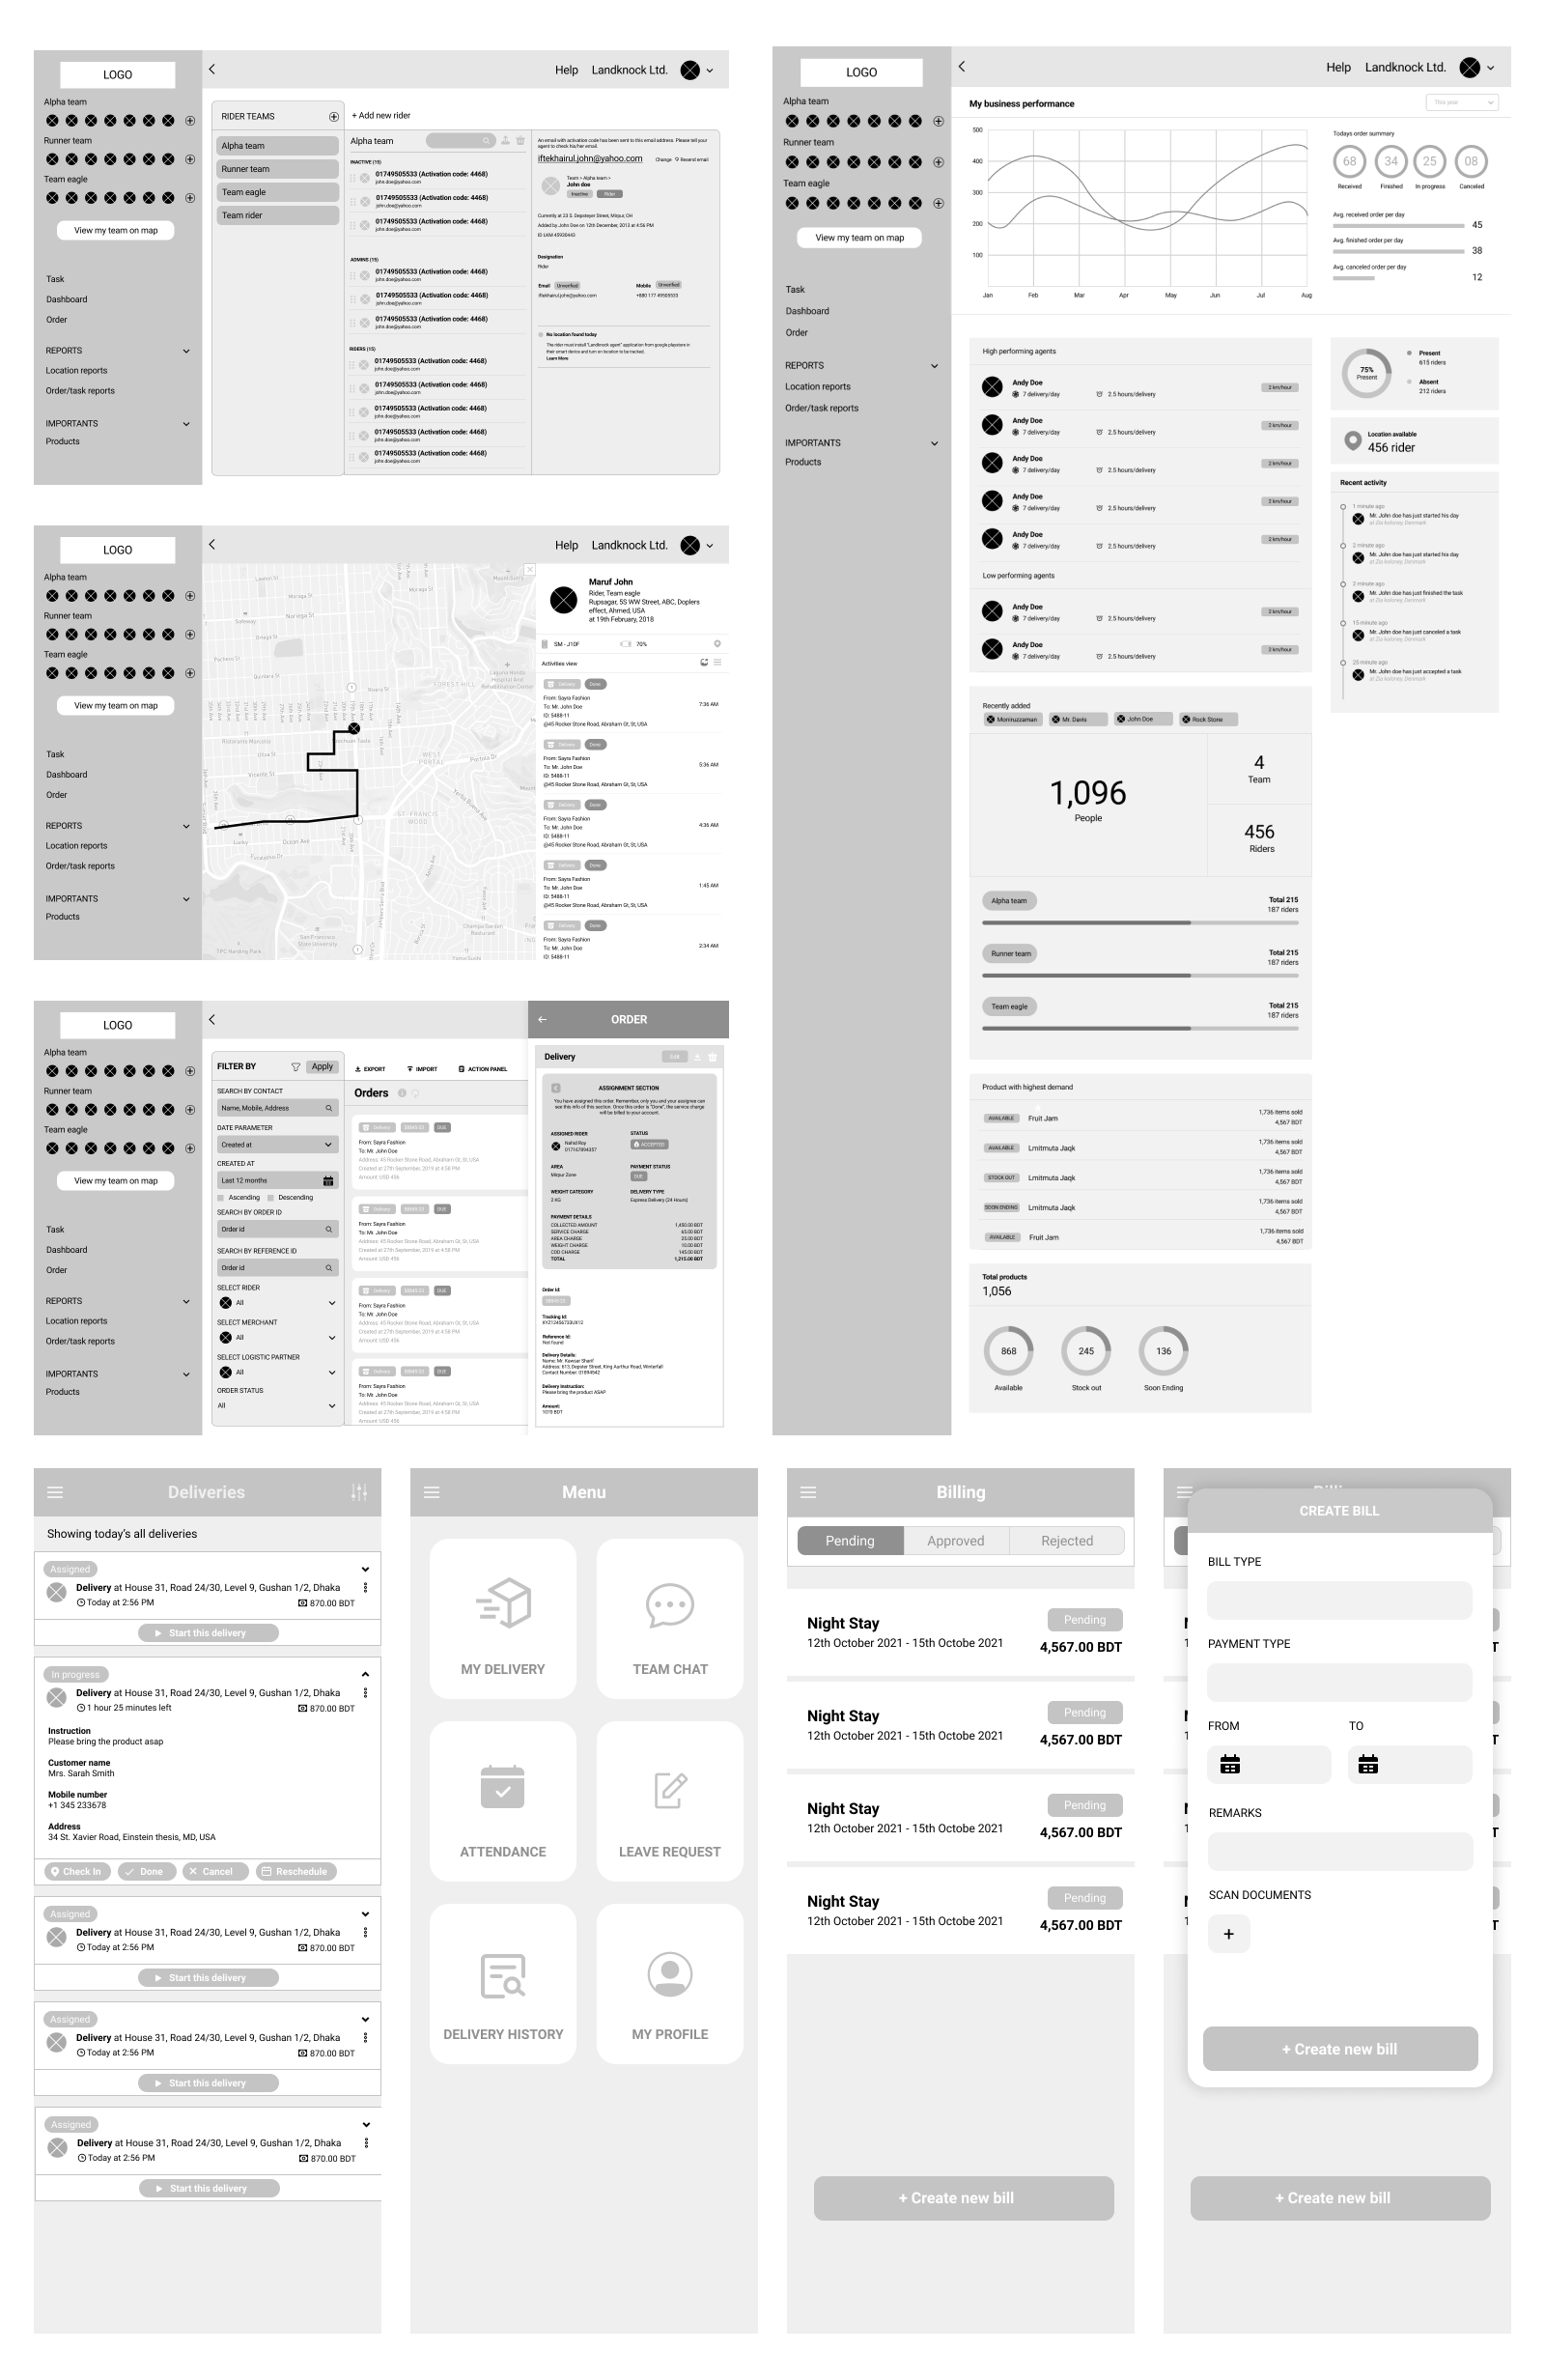
20+ iterations on the user flow came before a wireframe was final. The design took 30+ iterations over 12 months and more than 100 screens. I tested with potential customers in live sessions and by observation, and used Hotjar for heatmaps and session recordings. Continuous workshops with real users fed every round. Later, two more designers joined the team and I oversaw their work on the same system.
Design Decisions
The MVP brought real needs to the surface, and they shaped the product and its wireframes.
These customers were enterprises already using legacy software. A modern, highly interactive interface that felt unfamiliar would have slowed their work down, so I kept the design deliberately conventional. Some of these decisions went against my own taste, but they were what the users needed.
Field Team Always on the Left
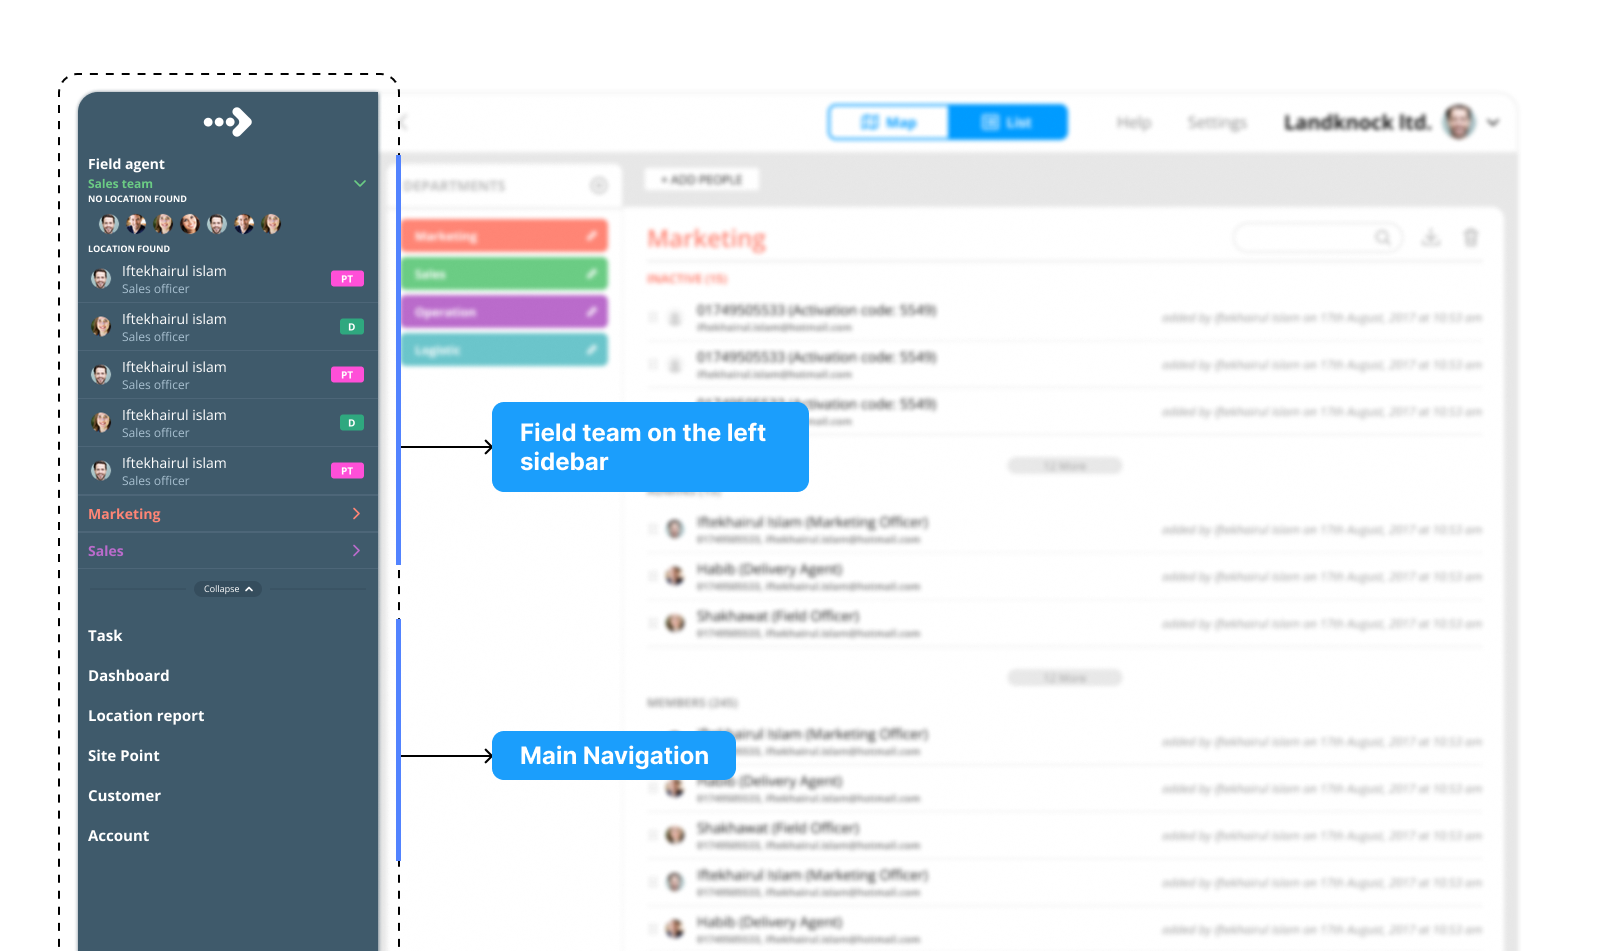
This is a field force product, so the moment someone opens it they should see who is active and who is not. The field team stays in the left sidebar on every screen, instead of behind the Map or Team pages. The users loved it.
Colors for Departments
Large customers have many teams across the country, so each department can be given its own color for faster scanning. They liked bright colors.
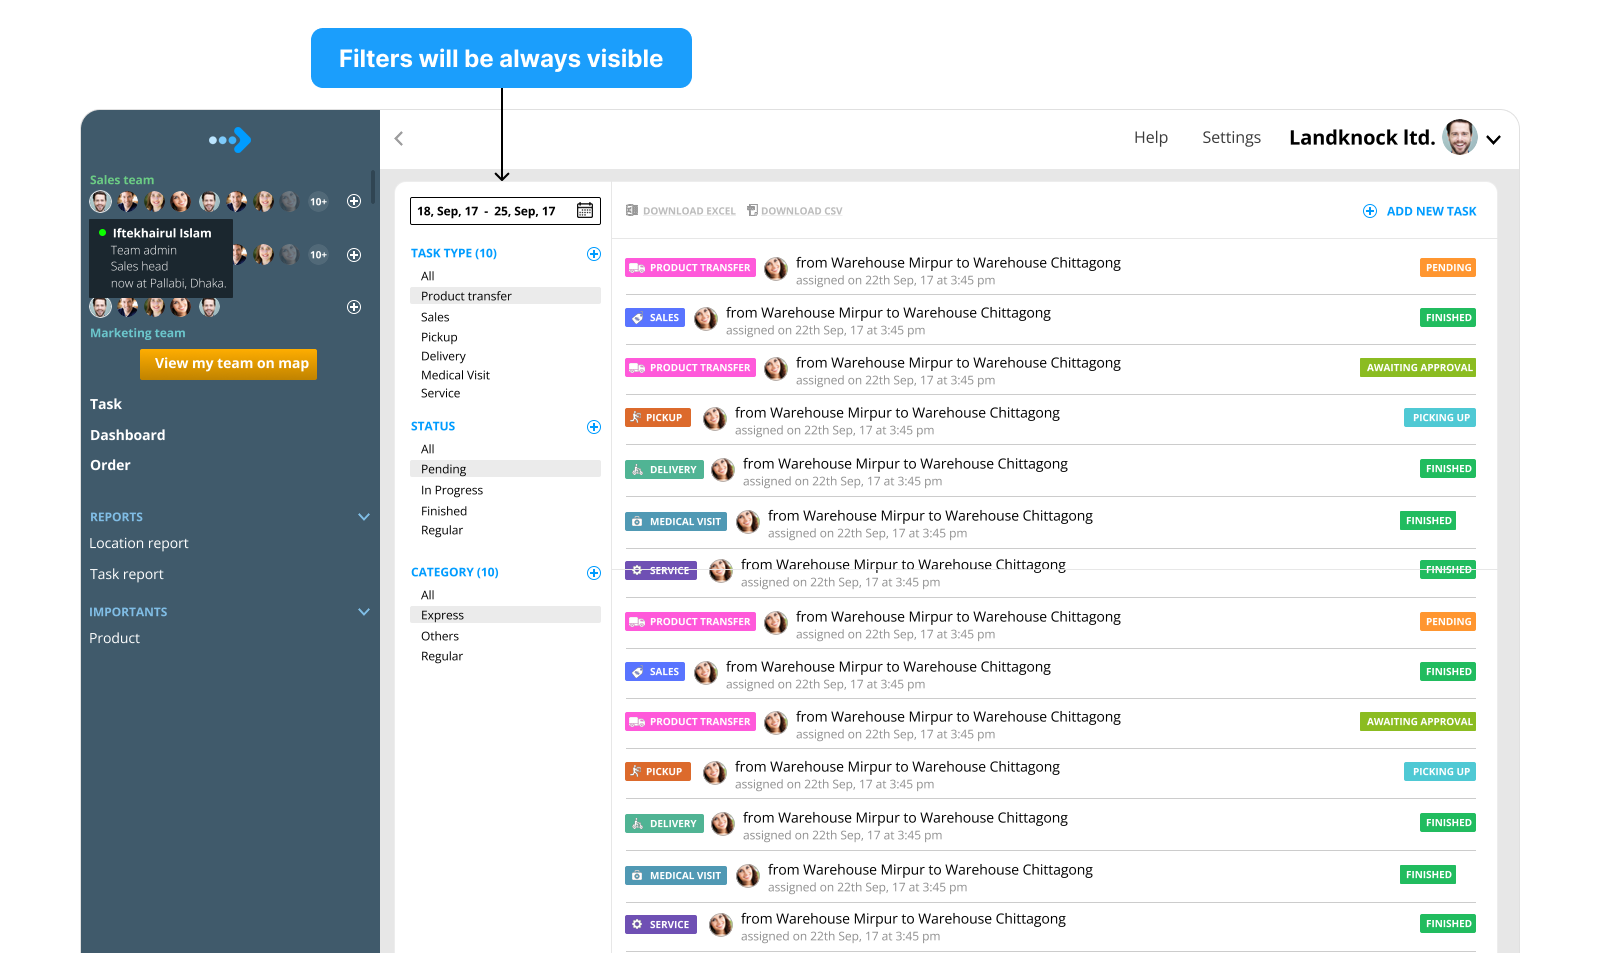
Filters Always Visible
Filters stay open in a dedicated panel instead of hiding behind a button. Some users were older and not used to progressive disclosure, where a click opens something new.
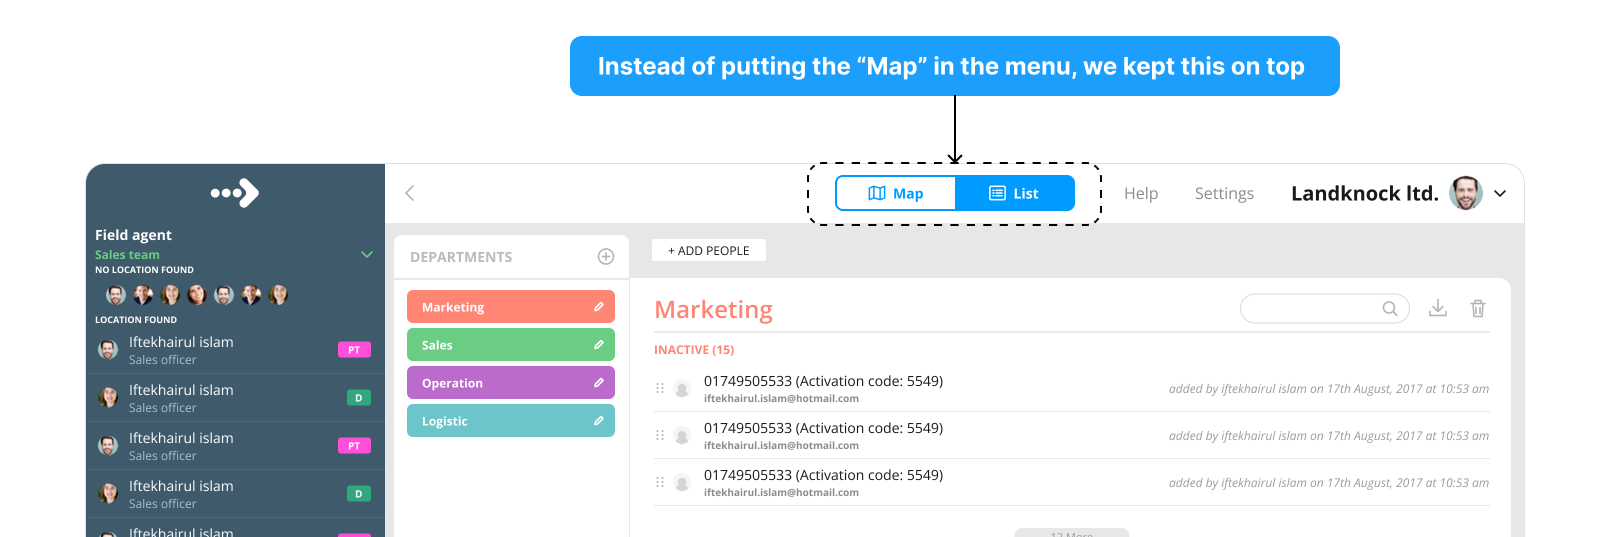
Map and List on Top
The Map and List switch sits in the top bar on every screen, instead of inside the menu.
Field App Adoption
After the MVP launched, the field workers were not using the app, and a tracking product only works if the people in the field actually use it. This was an adoption problem, and three changes to the mobile app addressed it.
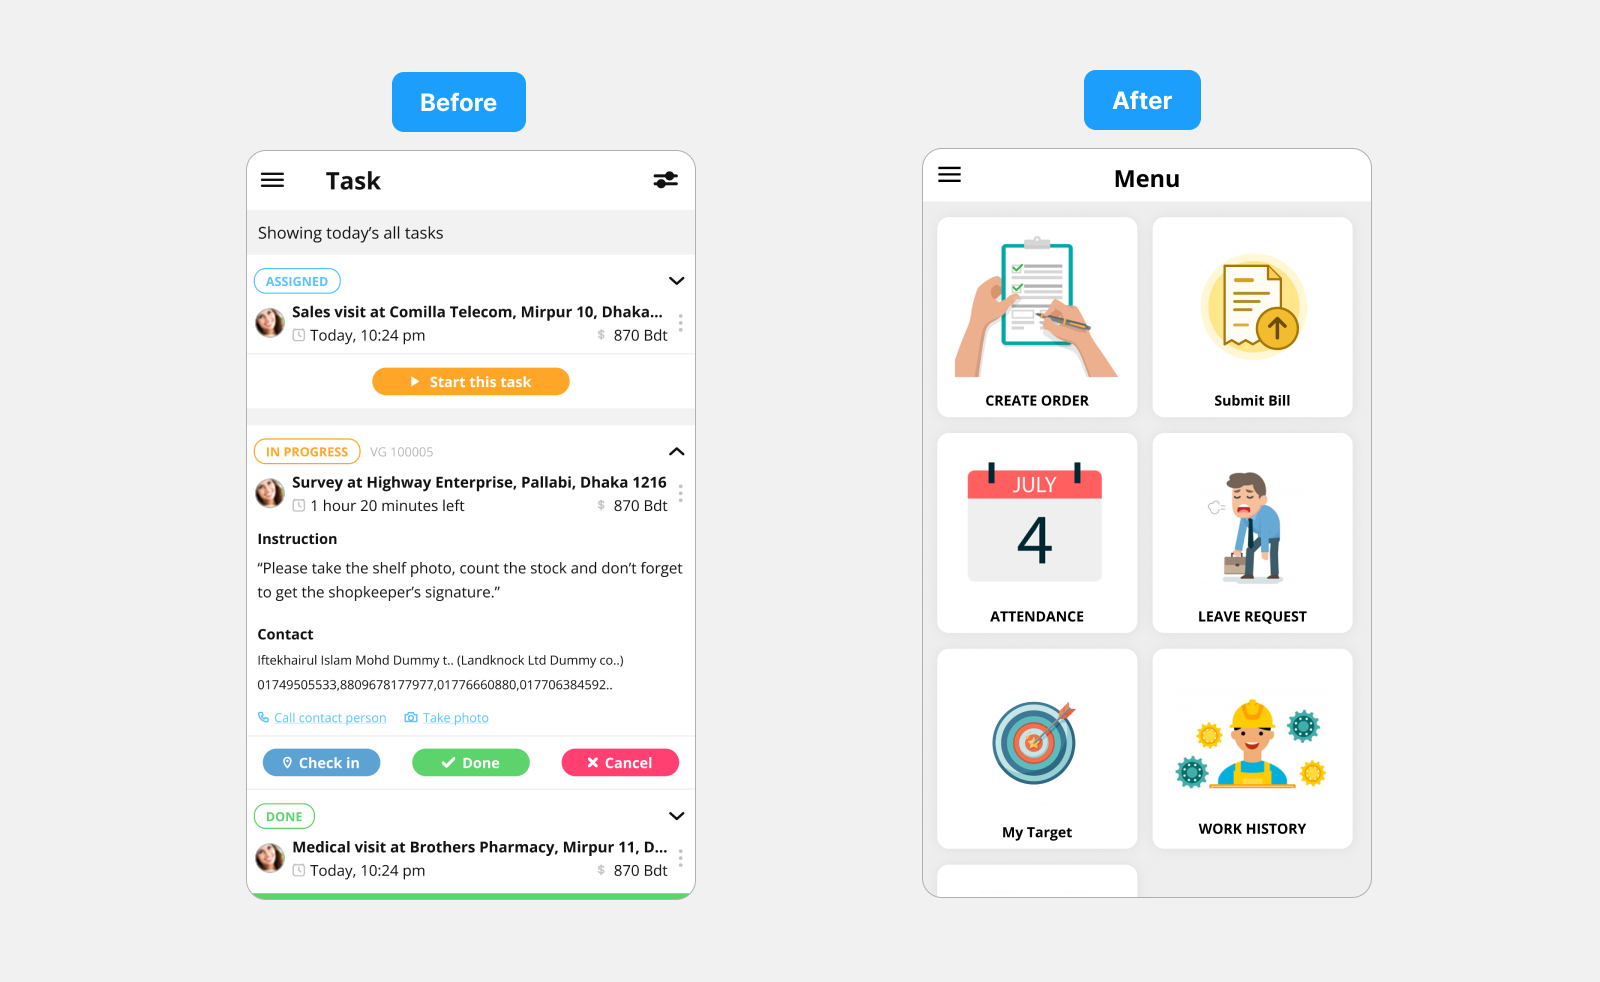
From a Task List to a Simple Menu
In the MVP, the first screen after sign in was a list of tasks. It overloaded field workers, and they could not see what the app was worth to them. We replaced it with a simple menu of large icons. They understood each function at a glance, and could see other things they needed, like attendance and leave requests.
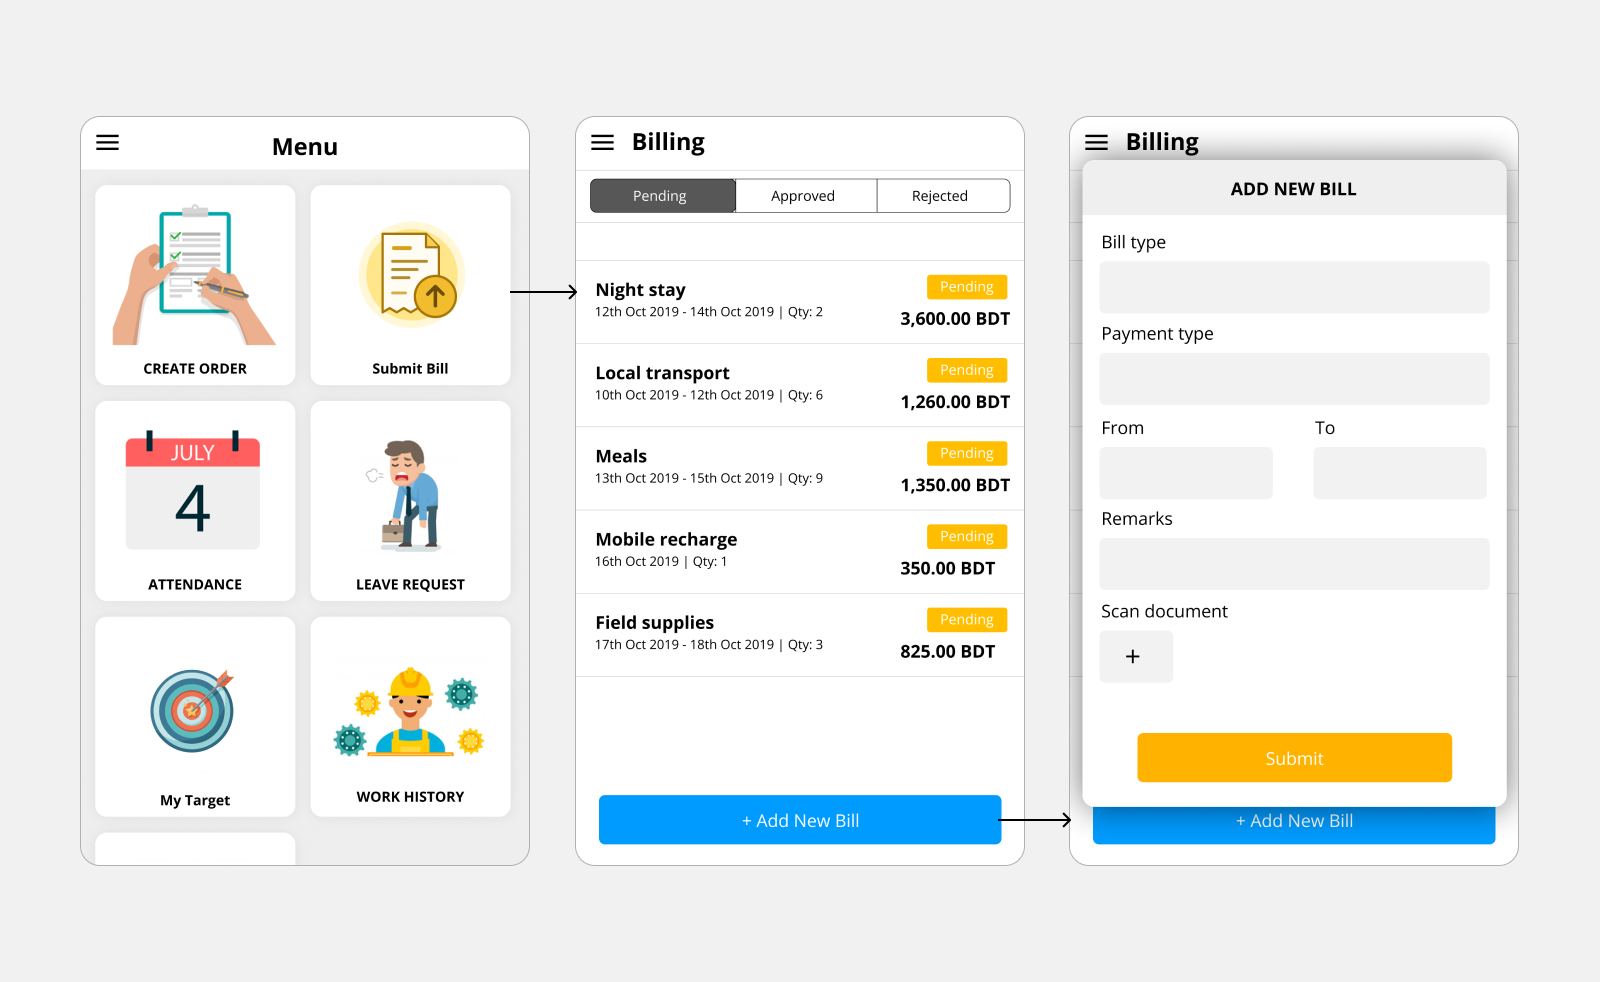
Bill Submission
Field workers spend their own money on the road and need it reimbursed. Once they saw they could submit bills from the app, it became useful to them, and adoption rose.
A Daily Target With a Progress Bar
Managers told us field workers already had a daily visit target, but it was only mentioned and never felt. We turned it into a progress bar that fills as visits are completed, to give a sense of reward. Workers made more visits, finished more of their work, and used the app more.
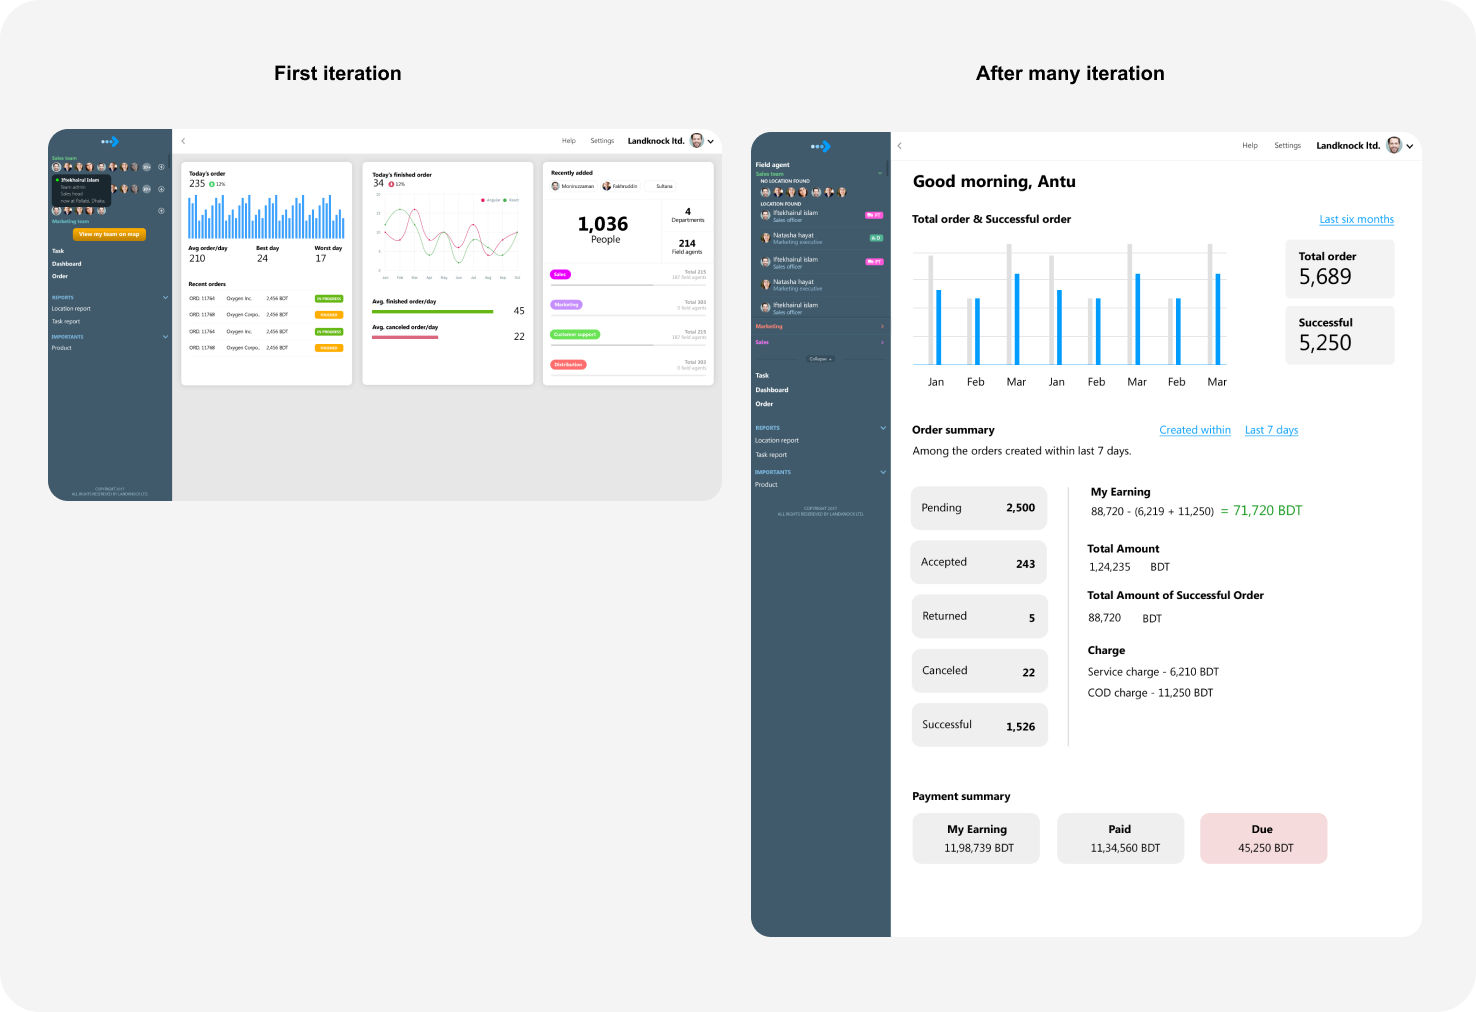
Dashboard Iterations
The first version showed raw order counts. Over 30+ iterations the dashboard came to answer what a head of operations asks first: order status, earnings, who is present and what just happened.
What This Taught Me
Whoever is paying and whoever is using the product are different people, and I have to talk to both.
The MVP succeeded with the people who bought it and nearly failed with the people who had to use it. I now interview the end user before launch, and I look for what the product gives them in return for what it asks of them.
Three more lessons from building enterprise software:
- Enterprise B2B takes longer to launch. Management can add new requirements mid-project, so constant stakeholder communication is what keeps the goal from shifting.
- Buyers pay for money and time saved, not polish. A dull-looking interface that clearly solves the problem gets a warm reception.
- Top-tier management wants everything configurable. Not a simple edit toggle, but full functionality and task-flow level editing. They need real freedom inside the app.